The median full-time UK salary is £39,039 a year as of April 2025, based on ONS data. Across both full and part-time employees, the median is £32,890 and the mean (average) is £40,269. The figures shift a lot once you break them down by working pattern, industry, education, age, gender and region.
Along with job satisfaction, working conditions and career prospects, pay is one of the most important aspects of a job. For many people, their salary is the single most important factor in their professional lives. But do you know how your salary compares? Do you know where you stand compared to the average UK salary? Compared to the average salary in your industry? Of people with your education level? This article is shining a bright spotlight on these very questions and demystifying pay in the UK.
Whenever we refer to salary or average UK salary, we mean total compensation. That is, base salary plus overtime pay, bonuses and any other components of work-related income (we’re not looking at non-work income such as rent income). Also, throughout the article, we are talking about gross salaries – so don’t compare these numbers with what hits your account but with the gross number on your pay slip. You can use an online tool to convert between the two.
All numbers refer to April 2025 stats unless otherwise specified and are based on official ONS data. Self-employed people are not taken into account. Unless we say otherwise, we’re looking at full-time employees – so if you only work two days a week, adjust accordingly.
Finally, a word on the average metric that we use in this article. There are two principal ways to measure an average – the mean and the median. Most people are familiar with the mean – it’s basically the sum of all observations divided by the number of observations. The median, on the other hand, is the mid-point, i.e. the observation which is both smaller and larger than 50% of observations. In this article, we will take the median as our principal metric so whenever you read about the average salary in the UK, read mid-point, not mean.
Average UK salary by working pattern
As we’ve seen, the average UK salary depends heavily on whether you count full-time or part-time work. In April 2025, full-time employees had a median salary of £39,039, while part-time employees had a median of £14,713.
Part-time roles pull the ‘all employees’ average down, which is why the full-time and all-employee figures look so different. Whenever you compare your own pay to a headline ‘average’, check which of these it actually refers to.
UK salary distribution and percentiles
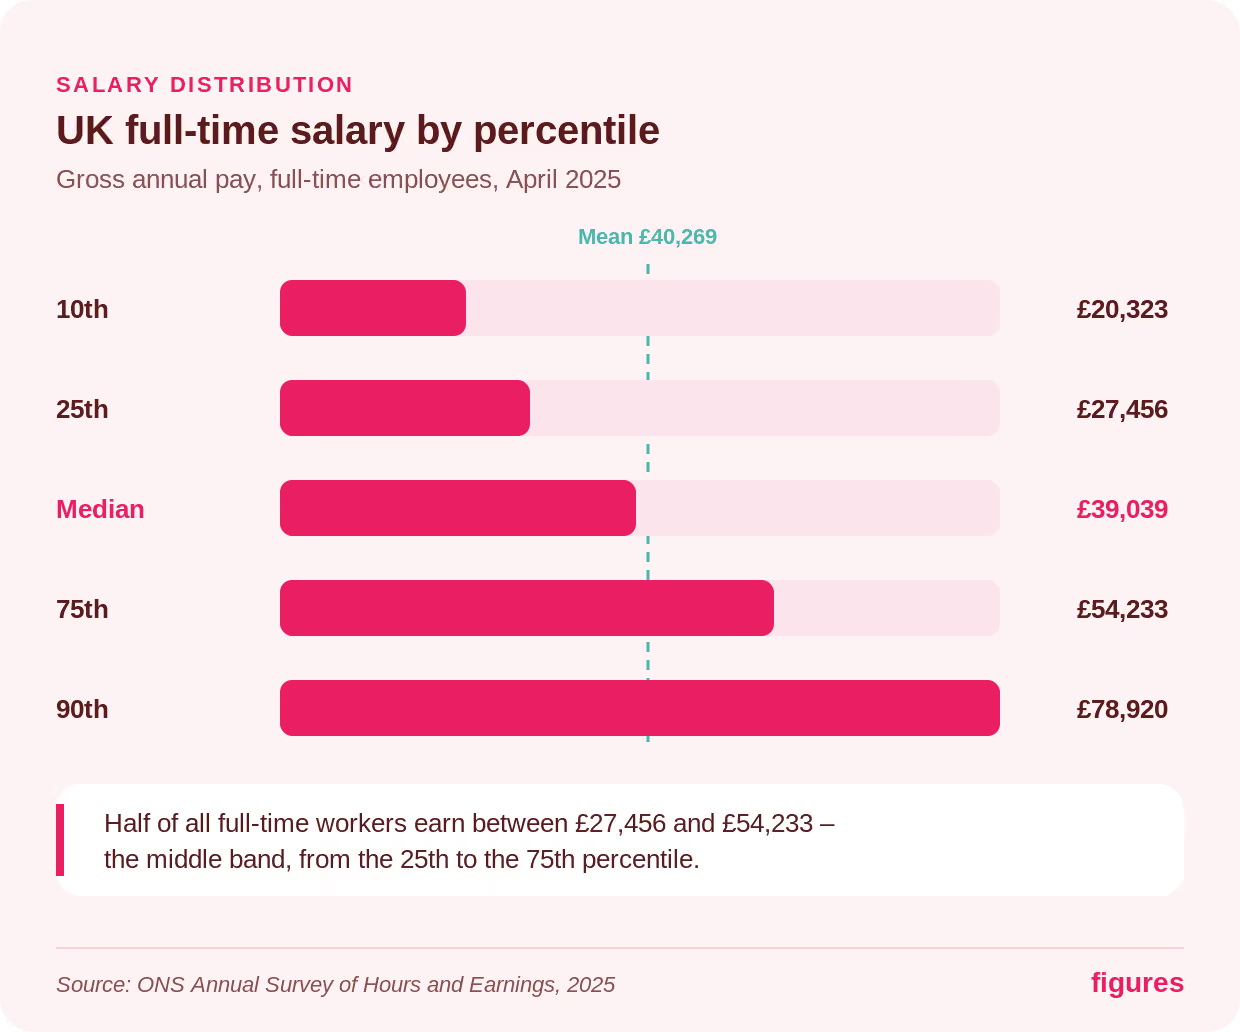
If the average (read median) full-time salary in the UK is £39,039 per year, that works out at about £750.75 per week. The mean, on the other hand, is £40,269 per year.
The mean sits above the median because a small number of very high earners (think a Harry Potter-era Daniel Radcliffe) pull the average up, whereas the median is unmoved by how extreme those top salaries get – which is why we use the median as our measure from here on.
Just like the median tells us the amount which 50% of people exceed and 50% of people fall short of, we can look at other interesting percentiles:
In plain terms: the lowest-paid 10% of full-time workers make less than £20,323 a year, and 90% make more than that. At the other end, the top 10% earn more than £78,920. And half of full-time workers sit between £27,456 (25th percentile) and £54,233 (75th percentile) – that middle band is where most people’s pay actually lands.
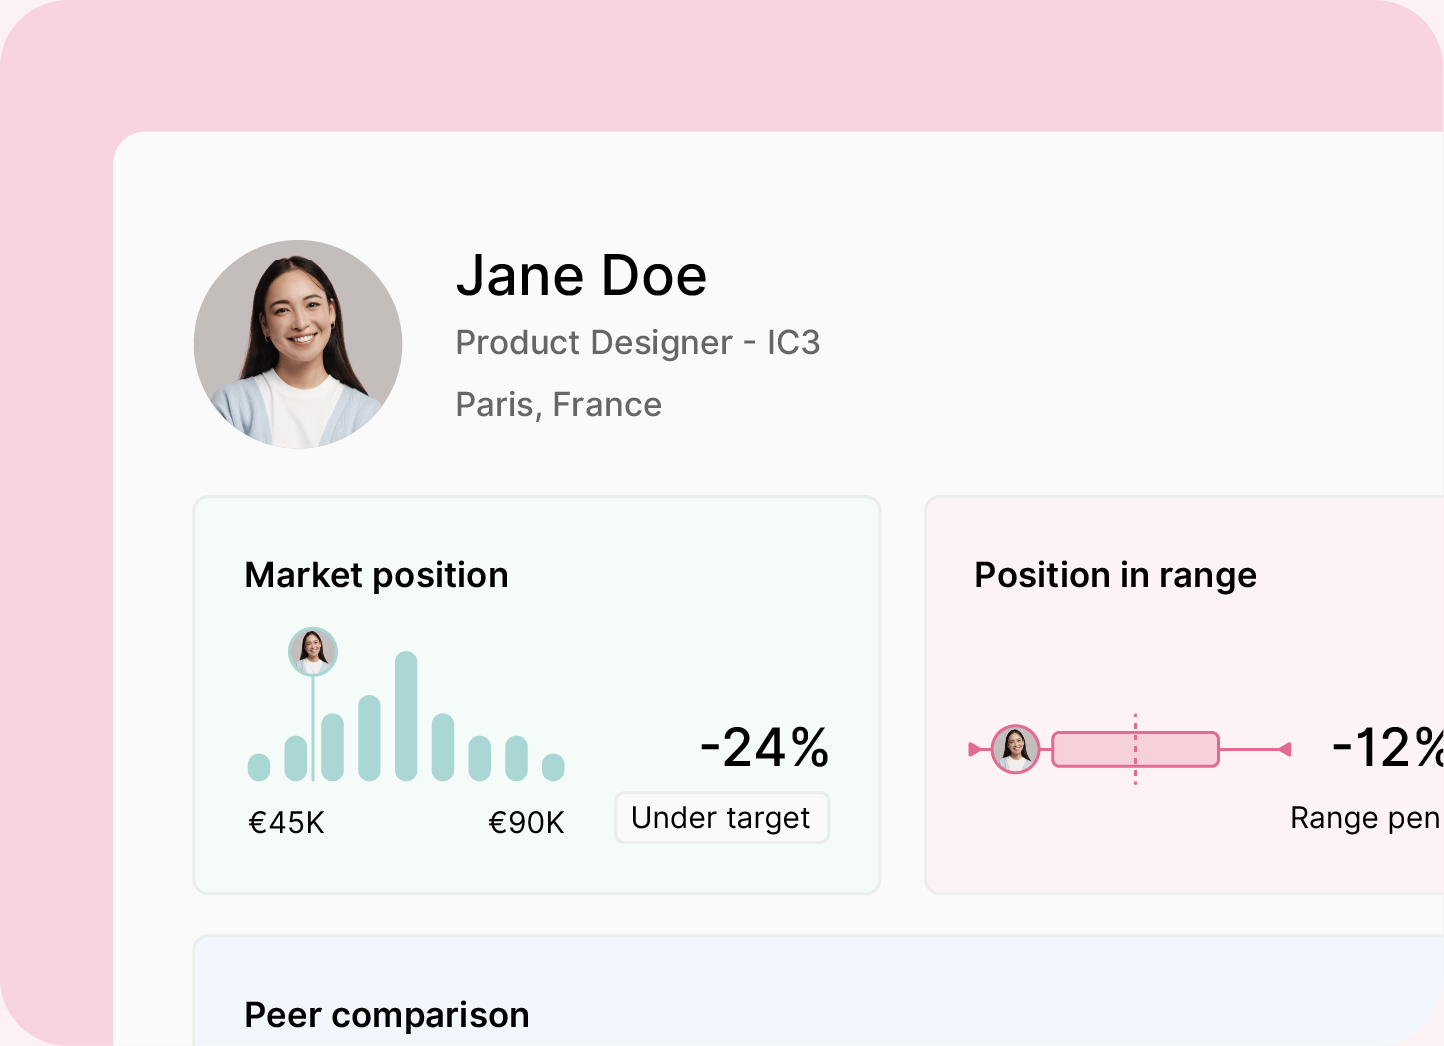
Pay data for fast-growing UK and EU companies, from 3.5 million datapoints, updated monthly.
Discover salary benchmarkingNow, if you have recently graduated from uni and still “only” make £20,000 that doesn’t necessarily mean that your employer is ripping you off. Remember, this chart shows the salary distribution and the average salary across all people in the UK, meaning people who are much older or more experienced than you; people who live in more expensive areas of the country; or people who work in industries that generally pay higher salaries (but often also have more intense working hours). So let’s look at how all these factors influence pay and how the average salary in the UK looks on a more granular level.
Average UK salary after tax (take-home pay)
Take-home pay is what lands in your account after income tax and National Insurance. Someone earning £40,000 a year takes home roughly £32,319 after tax and National Insurance – about £2,693 a month.
Want to run your own number? You can use a UK take-home pay calculator to convert gross to net. And if you’re setting pay for a team rather than checking your own, see how Figures helps you set and defend pay with real compensation data.
Average UK salary by industry and occupation
The industry or profession you work in is one of the key determinants of how well you’re paid – the average salary in the UK varies a lot between industries.
Let’s look at the data:
The spread is large – the best-paid industries pay well over double the lowest-paid ones. And if you have a role you could do in almost any industry – an accountant, say – where you take those skills makes a real difference to your pay.
But beware of assigning too much weight to this industry comparison – after all, you’re in ‘accommodation and food services’ both if you’re a waiter and if you’re the CEO of the Hilton group.
Some jobs pay far above the average and some far below it. Here’s a fuller look at the highest- and lowest-paid occupations in the UK, using the latest ONS occupation data:
Let’s look at some more breakdowns of the average UK salary.
Average UK salary by level of education
Chances are you weren’t too excited about doing your homework as a kid and got annoyed with your parents whenever they got too insistent on how important your education is. Turns out they actually had a point.
Source: DfE Graduate labour market statistics, 2024.
Pay climbs clearly with each step up in education. Graduates out-earn those without higher education, and postgraduates out-earn graduates again. In short, staying in education pays off.
Build salary bands that hold up to scrutiny and keep pace with UK and EU market data.
Discover salary bandsHere’s what that compounds to over a career. Say you start work at 18 without a degree on the no-higher-education average (£30,500 a year). Over 49 working years that’s about £1,494,500 in lifetime earnings.
Now say you’d stayed in education another 10 years for a PhD. You enter the workforce at 28 with 39 working years left on the postgraduate average (£47,000), for lifetime earnings of about £1,833,000. Even with 10 fewer years of work, the higher salary can more than close the gap.
Average UK salary for different age groups
Average UK pay rises through your career, peaks in your 40s, then declines. Younger workers earn least – they have less experience and often take lower-paid or apprenticeship roles – while pay builds as experience and qualifications accumulate.
Source: ONS
After the 40s peak, pay slides back down – and because these are all full-time figures, it isn’t simply that people work fewer hours with age – the hourly salary falls too.
UK regional differences in average salary
You can make more money in London than in Newcastle…shocker!
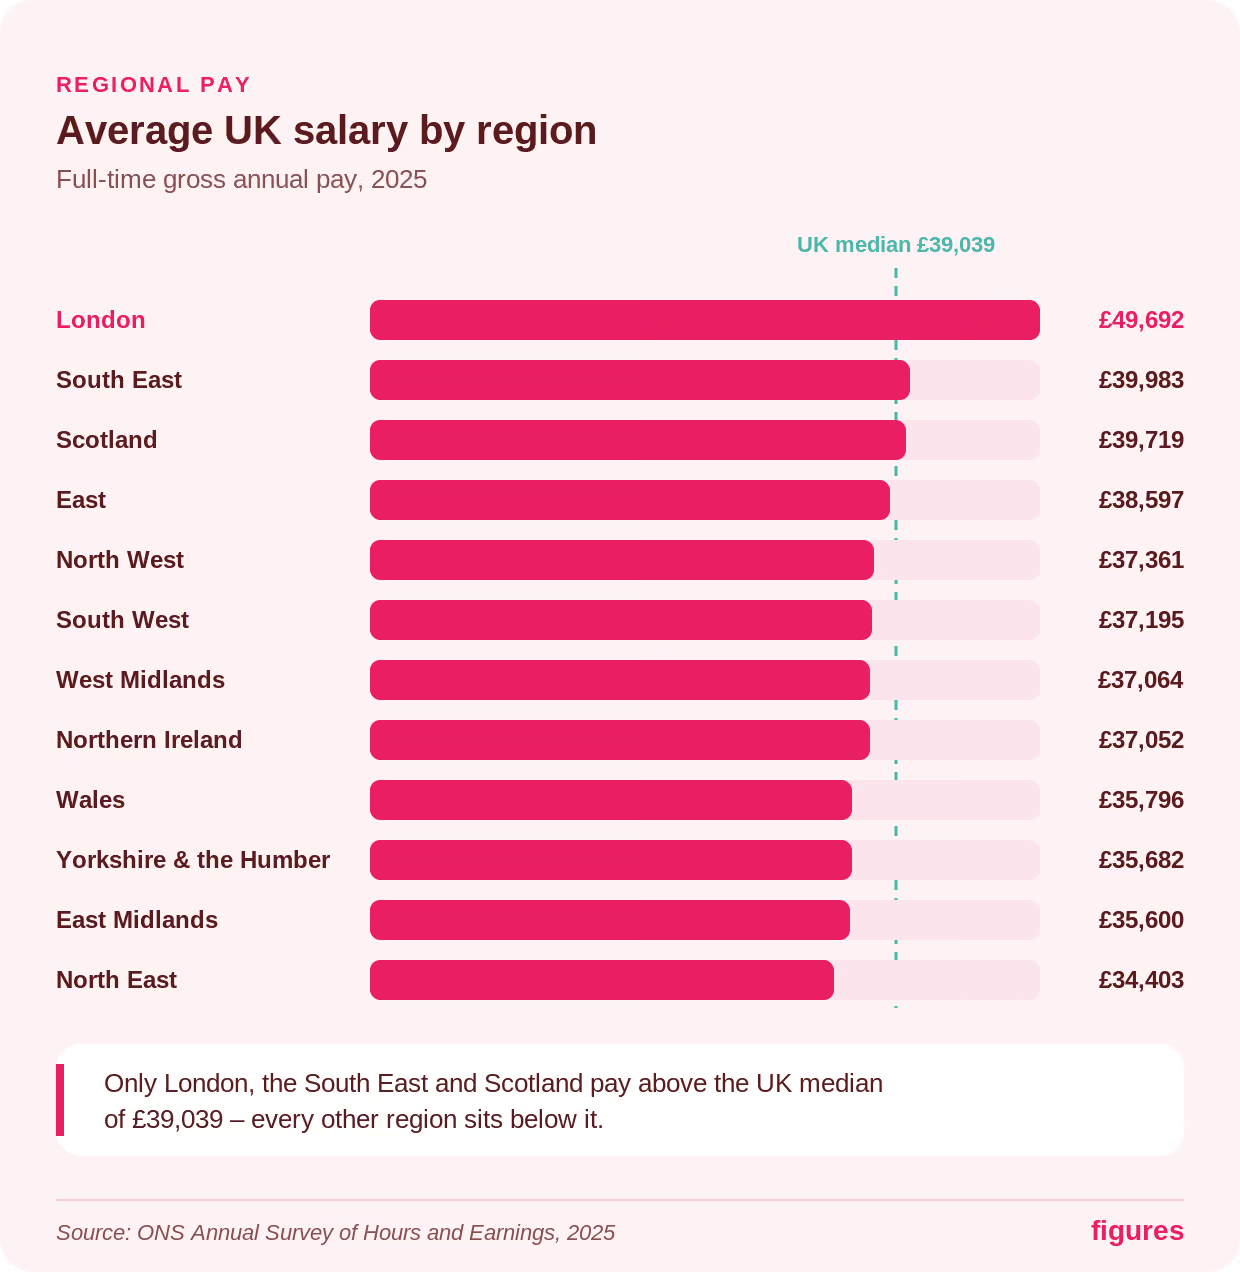
London has the highest average salary in the UK at £49,692, well ahead of every other region. But before you pack your bags, remember the cost of living in the capital is far higher too – which is exactly what the next section digs into.
Source: ONS
Remote and hybrid working muddies this picture. A London salary paired with lower living costs elsewhere in the UK is an appealing combination, and some employers now weigh regional pay differences when hiring remotely. Whether that narrows the regional gap over the next decade is still an open question.
How UK salaries compare to inflation and the cost of living
UK full-time salaries grew by 4.3% in the year to April 2025. Whether that’s a real pay rise depends on how it compares with inflation. On a weekly basis, median full-time pay rose 5.3% – and after CPIH inflation of 4.1% over the same period, that works out to a real-terms increase of about 1.1%. So pay edged ahead of rising prices, but only just.
What the average salary actually buys also depends on where you live. Set the typical take-home salary against typical monthly UK living costs – rent, bills and food – and the regional gaps from the section above start to matter more than the headline numbers.
For instance, while London boasts the highest average salary at £49,692, the ONS tracks its average monthly private rent at a steep £2,253. Now, compare that to a mid-table or lower region like the North East – the average salary is lower at £34,403, but the average monthly rent drops dramatically to just £767. Ultimately, London’s higher pay is offset by its higher costs, while a mid-table region can leave you with more disposable income month to month.
Gender pay gap
Men still earn more than women on average in the UK. The latest ONS data puts the median gender pay gap for all employees at about 12.8% (and roughly 6.9% for full-time employees). Part of that reflects differences in hours worked, but even comparing hourly pay, a real gap remains.
There’s a huge body of research on why this gap persists, from career breaks to occupational segregation. For our purposes here, the headline holds: on average, men still earn more than women in the UK.
If you’re interested in more info about the gender pay gap and how to close it – have a look at this article.
What it all means for HR and comp teams
National averages are a useful backdrop, but they don't tell an HR team what to actually pay a specific role, in a specific market, at a specific level. That’s the gap between ‘the average UK salary is £39,039’ and ‘what should we offer this candidate, in this location, at this level?’ – and it’s exactly the gap Figures closes.
With Figures, People and Compensation teams can benchmark roles against 3.5 million data points (with Mercer), build and defend salary bands, and run fair, transparent pay reviews – the kind of confident, data-backed decisions that pay-transparency expectations now demand. Averages tell you where the market sits, while Figures tells you what to do about it.
Make confident, transparent pay decisions – book a Figures demo
The EU Pay Transparency Directive is in effect. Find out where your pay gaps stand.
Discover pay transparency

Summarize this article with AI
No time to read it all? Get a clear, structured, and actionable summary in one click.