The median hourly wage in the UK is £19.67 for full-time workers, or £18.00 across all employees. Both are gross figures, before tax.
That one number is where a lot of pay decisions quietly go wrong. The mean tends to flatter. If you’re setting or sense-checking pay, the median is the fairer anchor.
This guide breaks UK hourly pay down the way compensation teams need it – by region, by gender, by pay band, full-time versus part-time, and how it has shifted over the past decade.
Working all this out by hand is painstaking – which is exactly why we built automated salary benchmarking into our Figures compensation decision platform. Let’s take a closer look at the data shaping the market.
The average hourly wage in the UK
Here are the headlines, in plain numbers, from the Government Office for National Statistics:
- The median hourly wage for full-time employees is £19.67.
- Across all employees, full- and part-time, it is £18.00.
- Full-time median pay rose 5.4% over the year, up from £18.66 in April 2024.
- The National Living Wage sits beneath all of this, at £12.21 an hour for workers aged 21 and over in April 2025, rising to £12.71 from April 2026.
👉 A quick word on why we lead with the median rather than the mean. The mean UK hourly wage is higher, but only because a small group of very high earners pulls it up. The median – the person standing exactly in the middle of the pay distribution – is the number most of your workforce will recognise. It’s the one to benchmark against if you want pay bands that hold up. It’s also the basis the ONS uses to define low and high pay, which we come to below.
“The median is a starting point, however, it’s not the whole answer. The moment you break pay down by region and level, you see where you’re actually competitive and where you’re exposed – and that’s the conversation worth having before transparency rules force it.” – Virgile Raingeard, Figures CEO
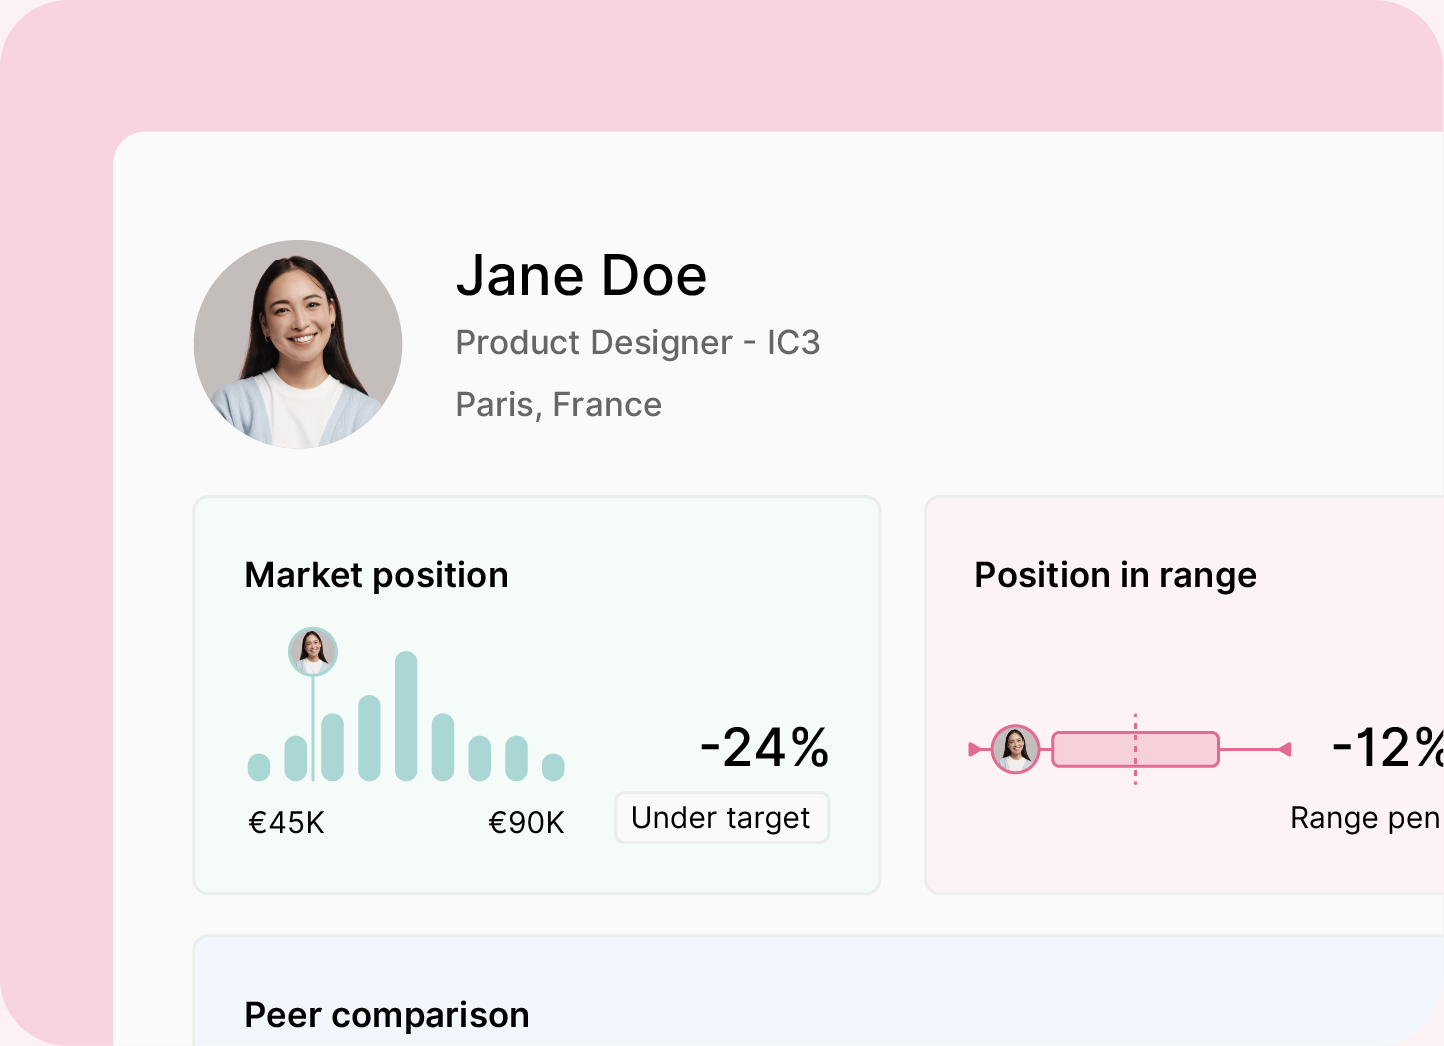
Pay data for fast-growing UK and EU companies, from 3.5 million datapoints, updated monthly.
Discover salary benchmarkingAverage hourly wage by UK region
National figures hide a lot. Where a role is based changes its market rate more than almost any other factor, so this is usually the first cut a compensation team needs.
Full-time employees in London earn the most, at around £25.40 an hour – well above the £19.67 UK median. The North East sits at the other end, at roughly £17.24. That’s a gap of about £8 an hour between the top and bottom regions for the same working week.
Source: ONS
⚠️ Remember, these are workplace figures, so London’s number partly reflects where high-paying head offices sit, not just what a London hire ‘should’ cost you. Benchmark to the region you’re actually hiring in.
Hourly pay by gender
The gender pay gap is narrowing – but slowly. For full-time employees, median hourly pay in April 2025 was £20.27 for men and £18.87 for women. That’s a full-time gender pay gap of 6.9%, down from 7.1% a year earlier.
Across all employees, the gap is wider, at 12.8% (down from 13.1%). It’s larger here because more part-time roles are held by women, and part-time work pays less per hour on average.
💡A gap that moves by roughly a fifth of a percentage point a year is simply not fast enough. And the fix isn’t a one-off audit – it’s structured pay bands and the gender pay gap reporting discipline to check, at every level, that people doing the same work are paid the same. That’s a design choice, and it’s one HR can actually make.
What counts as low pay and high pay in the UK
These aren’t vibes – the ONS defines both against the median in its 2025 research:
- Low pay is anything below two-thirds of median hourly pay – under £11.97 an hour.
- High pay is anything above 1.5 times the median – over £26.94 an hour.
The share of low-paid jobs has fallen to 2.5%, the lowest since the series began in 1997, largely as the National Living Wage has caught up with the bottom of the distribution. Just under a quarter of jobs (23.2%) now count as high-paid.
For anyone setting pay, £26.94 is the more useful of the two numbers. If you’re deciding what ‘competitive’ means for a senior role, that high-pay threshold is a cleaner reference point than a national average that lumps everyone together.
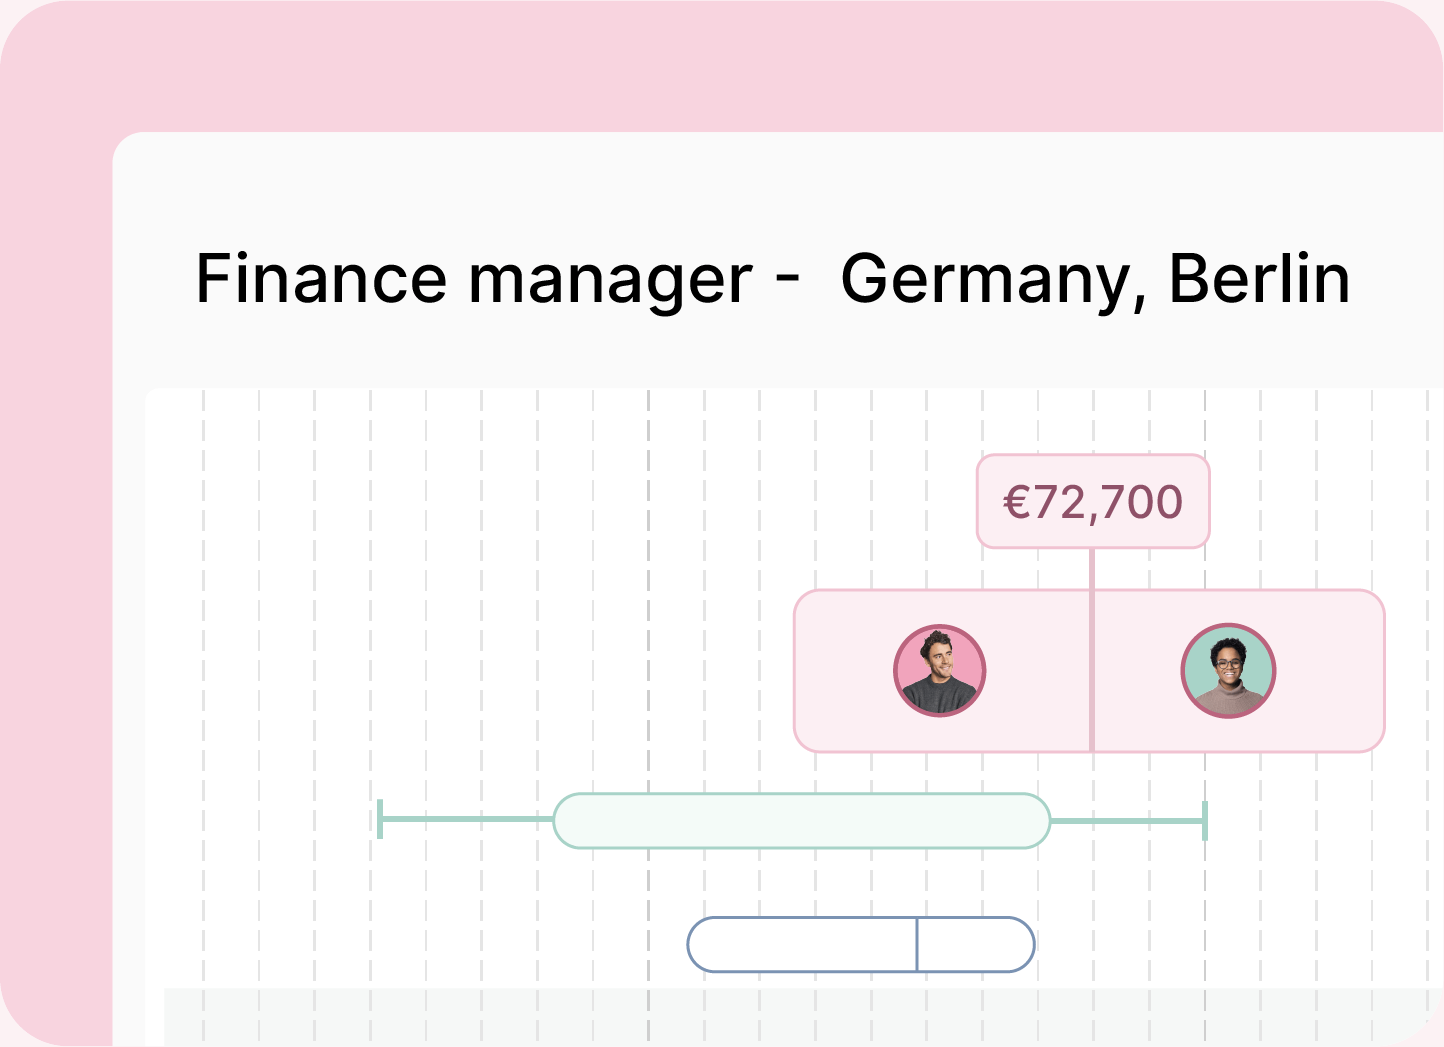
Build salary bands that hold up to scrutiny and keep pace with UK and EU market data.
Discover salary bandsPart-time vs full-time hourly pay
Full-time employees earn a median of £19.67 an hour. Part-time roles (median £14.11) pay £5.56 less per hour on average, although part-time pay is rising a little faster off that lower base – part-time median weekly earnings grew 6.4% over the year, against 5.3% for full-time.
There’s a genuinely interesting wrinkle for HR here. Among part-time roles, the gender pay gap actually runs slightly in women’s favour (–2.9%). The headline all-employee gap isn’t telling you part-time women are underpaid relative to part-time men – it’s telling you that part-time work itself pays less, and that more women are in it. That distinction matters when you’re deciding where to act.
How UK hourly wages have changed over the last decade
Pay has gone up in cash terms over the past ten years. Once you strip out inflation, the picture is far flatter – and for a stretch, it went backwards.
Source: ONS
The shape of it is what matters for pay planning. Real pay was squeezed hard through 2021-23 as inflation ran ahead of wage growth, then began recovering – full-time real median pay rose 1.1% over the year to April 2025.
The lesson for compensation teams is a simple one – an annual increase that looks generous on paper can still be a real-terms cut for your people. Benchmark against real movement, and not just the headline percentage.
How pay and hours vary by company type
Reputation says your industry dictates your life. The official picture is calmer. The ONS puts the average UK full-time week at 36.5 hours, and it has stayed close to 36-37 hours in recent years.
The sharper differences sit elsewhere – at role level and in pay, which official earnings data and industry salary guides do track. We’ll compare how hours and pay play out across four white-collar paths – private equity, management consulting, tech, and in-house corporate roles – drawing on published 2025 figures.
Do longer hours make people happier?
Not as much as you’d think. UK research drawing on the UK Household Longitudinal Study found that wellbeing is broadly stable across the range of working hours up to about 48 a week. There’s little difference between someone working eight hours and someone working forty-eight.
✅ The gains from paid work show up early, and piling on extra hours adds surprisingly little. That fits what we see in demanding professions, where long weeks often come with autonomy, responsibility and a sense of real impact. Past the 48-hour mark, though, the evidence for any wellbeing benefit runs out, and the risks start climbing.
Working hours by seniority
Official data shows far less variation than sector reputations suggest. The UK full-time week averages 36.5 hours, and hours differ only modestly across finance, professional services and tech.
The real divergence is at role level, in industry surveys rather than official data. A 2025 eFinancialCareers survey of 2,500+ professionals put private equity associates at 58 hours a week, with strategy consultants close behind at around 55. Tech and in-house corporate roles sit nearer the 40-hour national norm.
Where the number of hours pays off
Layer 2025 pay over those hours and a clear trade-off appears: long weeks quietly erode headline salaries.
- An MBB consultant on around £85k-£110k total, over roughly 55-hour weeks, works out near £39 an hour.
- A London developer, on a median £80k base over a standard 40-hour week, edges ahead at about £43 per hour, and far more at big-tech firms once equity counts.
- Private equity still leads – a £150k-£200k junior package over about 58 hours can clear £60.
Of these professional paths, consulting may squeeze the most effort out of you for the least you get back – on an hourly basis, of course.
Why satisfaction with longer hours rises with seniority
So why do higher-skilled professionals put up with longer weeks? In a word, autonomy. The CIPD Good Work Index 2025 finds most employees control how they work (78%), but only just over half (54%) control when they start and finish.
That freedom skews towards higher-skilled, professional roles, which report more autonomy than lower-skilled ones. CIPD links greater control to better wellbeing and self-reported performance, though it stops short of calling it the single biggest driver of satisfaction.
💡The pattern for demanding careers is less that senior work gets lighter, and more that people gain some say over when the long hours happen.
What this means for setting pay
If you’re the one making pay decisions, here’s what the 2025 data actually asks of you:
- Benchmark to the regional median, not just the national one. An £8-an-hour swing between London and the North East is too big to average away.
- Check for a gender gap at the same level, not across the whole company. The headline number is mostly a mix effect – the gaps that expose you are between people doing the same job.
- Anchor ‘competitive’ to the £26.94 high-pay threshold, not a national average, when you’re pricing senior roles.
- The EU Pay Transparency Directive applies to companies with employees in the EU from June 2026. If that’s you, documented, defensible pay decisions are what pay equity analysis makes possible.
None of this needs a bigger spreadsheet. It needs one source of market data and a way to see your bands against it.
Figures gives compensation teams live market data, structured salary bands and pay equity analysis in one place – so pay decisions are fair, fast and easy to defend. Book a demo →
Looking for more compensation resources?
We built Figures so you don’t need to become a compensation expert. Our platform brings real-time market data, salary bands, compensation reviews and pay equity into one place, so HR teams can make fairer pay decisions with less effort.
- Follow us on LinkedIn for compensation and pay-transparency insights
- Read more on the Figures blog
- Watch product walkthroughs on YouTube
Ready to see fair, transparent pay in action? Book your free Figures demo →
Run the entire comp lifecycle in one place. Built for HR teams in the UK and Europe.
Get a custom demo

Summarize this article with AI
No time to read it all? Get a clear, structured, and actionable summary in one click.