Picture this: you’re reviewing your organisation’s pay data and discover a 15% gender pay gap. Is it discrimination? Poor data quality? Or something else entirely?
Calculating the gender pay gap accurately is the first step toward creating a fairer workplace. Yet many HR professionals struggle with the complexities, from choosing between mean and median calculations to understanding what the numbers actually reveal about their organisation.
The good news? With the right approach, these calculations become powerful tools for driving meaningful change. They’re also quite important if you want to prepare for the UK’s mandatory reporting requirements or get ahead of the EU Pay Transparency Directive.
In this guide, we’ll demystify the calculation process, explore what your results really mean, and show you how to transform raw data into actionable insights that benefit everyone in your organisation.
Understanding the gender pay gap: the foundation for workplace equity
The gender pay gap measures the difference between what men and women earn on average across an organisation. But here's what many get wrong: it’s not the same as pay equity, which focuses on equal pay for equal work.
Yes, the UK’s gender pay gap has fallen by about a quarter over the last decade, reaching 7.0% in April 2024. But let’s be honest – at this rate, our grandchildren will still be having this conversation.
Why such slow progress? The roots run deep:
- Educational steering: From childhood, girls are nudged toward “caring” and lower-paid professions while boys dominate STEM fields.
- The motherhood penalty: Women often sacrifice career progression for family responsibilities because we’re still expected to take on the majority, if not the entire, child and home care.
- Sectoral segregation: Female-dominated industries systematically pay less than male-dominated ones.
- Unconscious bias: Even well-meaning managers make assumptions that limit women’s opportunities.
To put it mildly, there’s still a long way to go. However, this requires conscious efforts from everyone, but most of all, people in positions of power.
One way the gap is being addressed is through legislation.
For example, in the UK, companies with 250+ employees must report their gender pay gap annually – it’s the law under the Gender Pay Gap Information Regulations 2017. Come 2026, the EU Pay Transparency Directive will tighten the screws further.
And if you thought the UK gap was bad, a 2023 study found that there is still a significant gap in many countries, reaching up to 19% in Latvia, and on average, women’s gross hourly earnings are 12% lower than men’s across the EU.

However, beyond human decency and legal requirements, workplace equity is just as vital for hiring, retention, and employee engagement.
63% of job seekers would skip applying to companies with known pay gaps for similar work. Considering how talent-scarce the market is now, can you really afford to lose over half your potential candidates before they even apply?
Essential calculation methods for unadjusted pay gaps
The unadjusted pay gap is your starting point for understanding gender pay disparities in your organisation. Think of it as a wide-angle photograph – it captures the overall picture but misses the finer details.
Here’s how you can calculate it:
- Add up all male employees’ hourly pay rates.
- Divide by the number of male employees to get the average.
- Repeat for female employees.
- Calculate the percentage difference between these averages.
Simple, right? But this simplicity comes with significant limitations.
The unadjusted pay gap throws everyone into the same calculation blender – CEOs with interns, rocket scientists with receptionists. It's statistical soup that doesn't account for:
- Job roles: Your CEO and junior analyst are lumped together.
- Experience levels: A 20-year veteran counts the same as a new graduate.
- Qualifications: PhDs and GCSEs receive equal weighting.
- Working patterns: Full-time and part-time employees mix in the same pool.
- Seniority: Directors and assistants share the same calculation.
- Intersectional factors: The compounding effects of age, race, disability, or LGBTQ+ status remain invisible.
Still, despite its limitations, the unadjusted pay gap has its purpose. It reveals the overall distribution of men and women across your pay scales. A large unadjusted gap often signals structural issues – perhaps women cluster in lower-paid roles or hit glass ceilings that prevent advancement.
Think of it as your organisation’s vital sign. While it won’t diagnose the specific illness, an abnormal reading tells you something needs attention. That’s why UK regulations (and soon EU, too!) require this calculation – it’s the canary in the coal mine for workplace inequality.
Mean vs. median
Before diving into calculations, you’ll need the right data. Both UK and EU regulations require hourly pay rates for all full-pay relevant employees, though the specific requirements vary by country.
Now, let’s demystify these two calculation methods:
- Mean gender pay gap = The difference in average hourly pay between all men and all women. Calculate it by adding all hourly rates and dividing by the number of employees.
- Median gender pay gap = The difference in middle-point hourly pay between all men and all women. Find it by lining up all employees from lowest to highest paid and picking the middle person.
Why both matter:
Both calculations are important because they tell different stories about your organisation:
- Mean reveals leadership gaps: A few highly-paid male executives can skew your mean dramatically upward. If your mean gap exceeds your median gap, you likely have a senior leadership diversity problem.
- Median shows typical employee experience: This number represents what’s happening for most of your workforce. It's less sensitive to outliers and gives a clearer picture of everyday pay disparities.
Together, they’re like having both an X-ray and an MRI – each reveals different aspects of your organisation’s pay health.
Beyond basic pay:
Current regulations also require you to calculate:
- Bonus gaps (both mean and median) – often even more revealing than base pay.
- Pay quartile distribution – showing whether women cluster in lower-paid roles.
For example, the UK already mandates these metrics, while the EU Pay Transparency Directive will require similar reporting from 2026, including pay gap reporting for companies with 100+ employees.
These additional metrics help identify where intervention is most needed. After all, equal representation at every level beats having a token woman in a leadership position.
Interpreting and communicating your results
Your calculations reveal patterns that demand different responses:
High median, low mean gap? Women are hitting a glass ceiling – often clustered in junior roles with limited opportunities for progression.
Low median, high mean gap? Your leadership pipeline has sprung a leak. Few women reach executive positions despite fair representation below.
Similar gaps across all quartiles? This signals systematic undervaluation of women’s work throughout your organisation.
When presenting findings to stakeholders, ditch the defensiveness. Instead of “explaining away” gaps, frame results as opportunity mapping. Each gap represents a chance to tap into underutilised talent and strengthen your organisation.
🧐Remember: greater pay transparency accelerates progress. When employees understand how pay decisions are made, trust increases and gaps naturally narrow. Think of transparency not as exposing problems, but as illuminating pathways to solutions.
Translating calculations into actionable equity strategies
Numbers without action are just expensive wallpaper plastered over the cracks. If you want the real stuff, you need to connect your calculations to targeted interventions through systematic pay equity analysis.
Here’s what that looks like:
Transform data patterns into precise strategies
Are women concentrated in the bottom quartiles?
- Launch targeted promotion programmes focused on high-potential women.
- Create skills development pathways for roles with better progression.
- Set quarterly targets for internal female promotions.
Is the executive pay gap exceeding 15%?
- Mandate 50/50 shortlists for senior positions.
- Conduct immediate equity compensation audits.
- Establish diverse succession planning with named candidates.
Department-specific clustering?
- Design cross-functional mobility programmes.
- Align pay bands across departments.
- Create rotation opportunities in higher-paying divisions.
Build an implementation hierarchy
Phase 1. Immediate corrections (0-3 months)
Fix direct pay inequities where women earn less for identical roles. This builds trust and demonstrates commitment.
Phase 2. Structural reforms (3-12 months)
Redesign promotion processes, create transparent career pathways, and ensure equal access to stretch assignments. Address the systems creating gaps, not just the symptoms.
Phase 3. Cultural transformation (12+ months)
Implement unconscious bias training, establish mentorship programmes, and embed equity into performance metrics. Culture change takes time but ensures lasting results.
“When you fix immediate inequities, reform your structures, and shift your culture, you're building a workplace where talent thrives regardless of gender. The outcome? Better retention rates, stronger teams, and a reputation that attracts the best people in your industry.” – Agnès Chauvigny, VP People at Figures
How Figures pinpoints pay disparities at every level of your organisation
Manual calculations in spreadsheets? That’s like using a magnifying glass when you need a microscope. Figures’ Pay Equity solutions transform complex data into clear, actionable insights.
Uncover gaps across your entire workforce
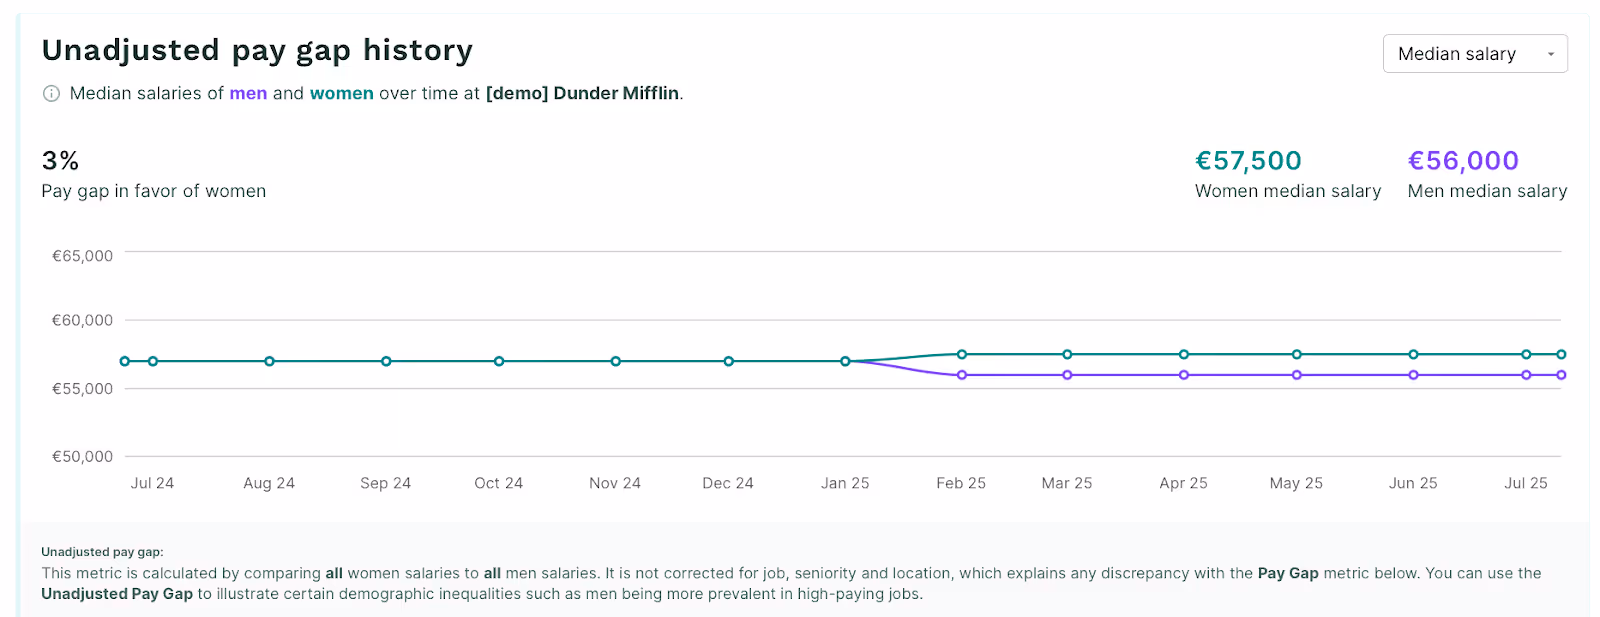
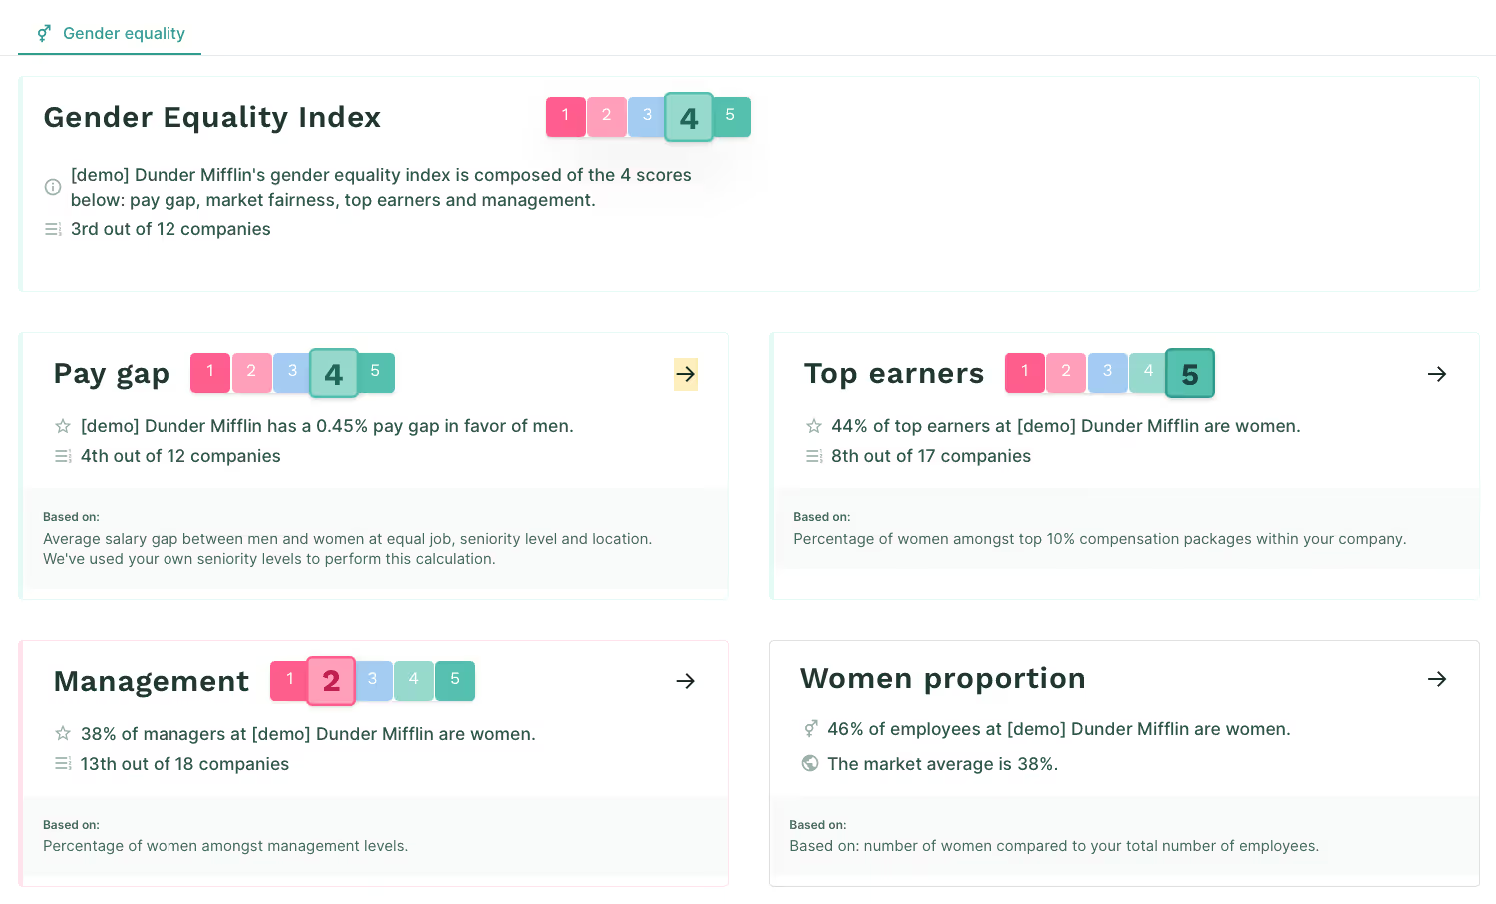
Figures provides visual, data-backed breakdowns that reveal hidden disparities – from glass ceilings to pay quartile distributions. The gender equality tab tracks your unadjusted pay gap over time, showing whether you're making real progress or just treading water.
Your Gender Equality Index scores benchmark performance against industry standards, answering that critical question: “How do we really compare?”
Zoom in on individual insights
Here’s where Figures shines: granular analysis that identifies specific employees with potential pay gaps.
Rather than dealing with anonymous averages, you can assess individual situations and make informed decisions. You can also look at the compa-ratio for specific roles, seeing the gender gap for that job.
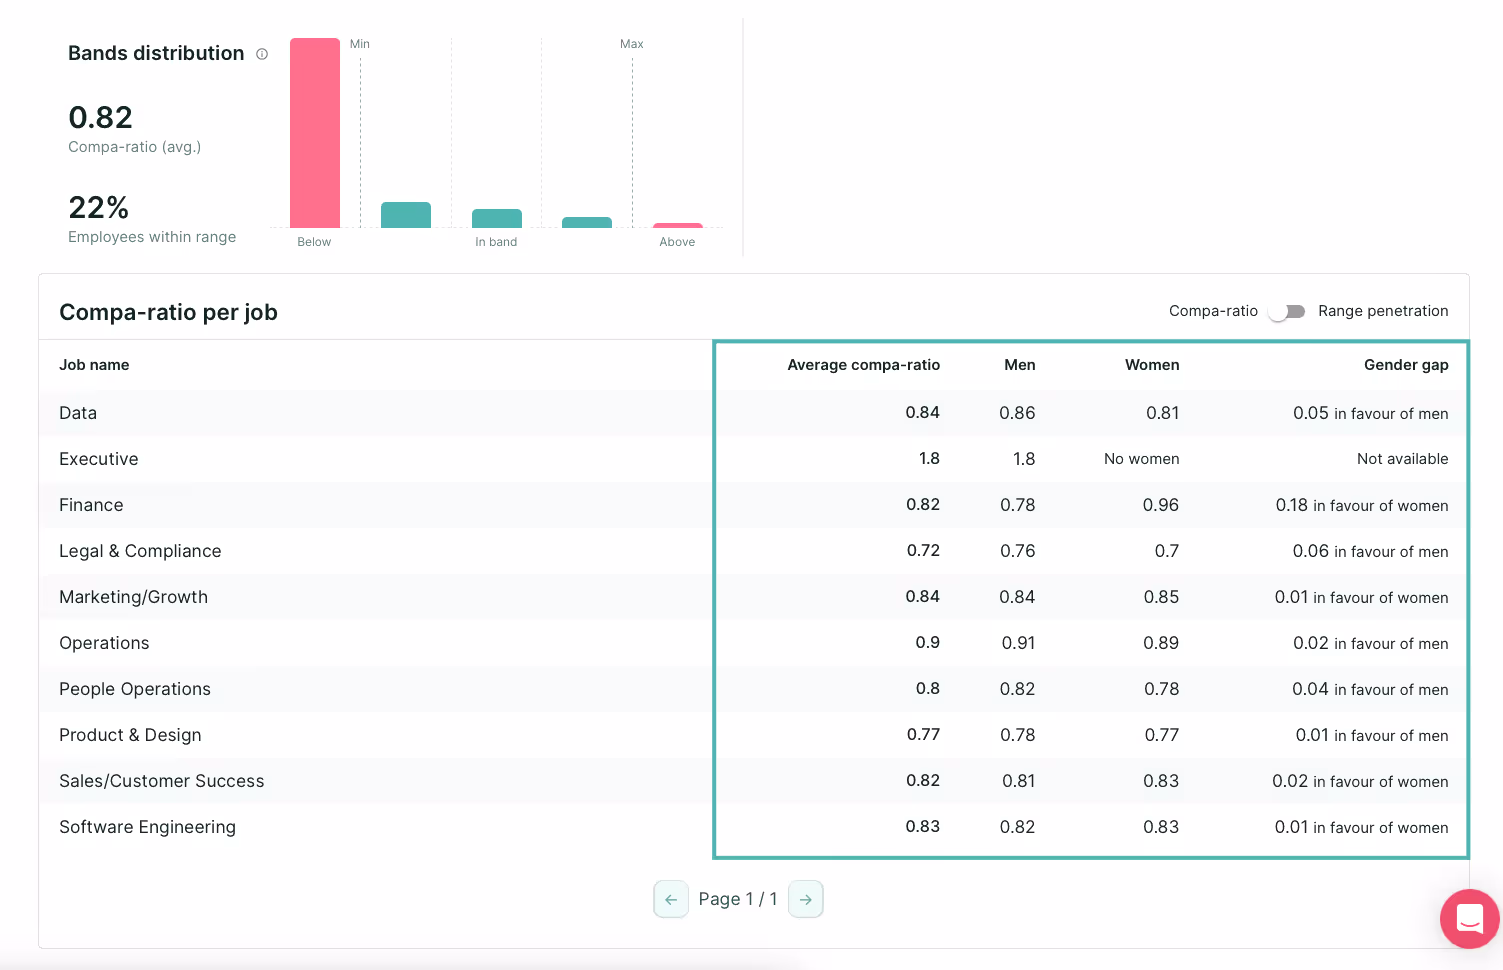
This precision enables you to distinguish between legitimate pay differences and actual inequities.
Data-driven decisions, not guesswork
Figures calculates both unadjusted and adjusted pay gaps – the latter accounting for factors like job role, education, and experience. This dual approach helps you:
- Identify which gaps reflect genuine inequity.
- Justify legitimate differences with solid data.
- Generate clear recommendations for closing unfair gaps.
"Figures helped us build a full salary transparency structure, making it easier to transition into an open, fair compensation model," shares Emma Herrero, Strategic HR Leader at Phiture.
Start your pay equity journey today: calculating gaps to drive meaningful change
"Surface-level gender pay gap calculators only tell you there’s a problem – they don't tell you where to focus your resources. When 82% of companies joining us have gaps too high for 2026 regulations, it’s clear that traditional reporting isn’t enough. What organisations need is the ability to pinpoint disparities at every level, so they can make the right call about where to intervene. That granular insight is what separates companies that improve their numbers from those that just report them." – Virgile Raingeard, CEO & Former HR Leader at Figures.
So, are you ready to move beyond basic calculations? Our comprehensive ebook on Gender Pay Gap and Pay Transparency provides deeper insights into building equitable compensation structures.
💡 Remember: calculating your gender pay gap is just the beginning. The real work lies in understanding what drives those numbers and taking targeted action. With Figures, you gain the precision tools needed to identify, analyse, and close pay gaps at every level of your organisation.
Book your free demo today and discover how to transform your pay data into a competitive advantage.