A salary spreadsheet on your screen, an employee’s rate next to a range midpoint, and a percentage you need to defend to a line manager. Sound familiar?
That single percentage is a compa-ratio. It’s the core metric for checking whether pay sits above, on, or below the midpoint you’ve set for a role. When you’re balancing tight budgets, internal equity and talent retention, getting this number right matters.
This guide breaks down what a compa-ratio is, how to calculate it in £, and how to read the results across three distinct types. We’ll also clear up a common point of confusion: how compa-ratio differs from range penetration, and how to use both effectively.
Key points:
- Midpoint is internal, not live market: A compa-ratio measures base salary against your internal salary band midpoint; an outdated band masks uncompetitive pay.
- 100% isn’t an automatic pass: It simply means paying on target; determining true fairness requires layering tenure, performance, and policy goals.
- Groups beat simple averages: When assessing whole teams, average compa-ratios get easily skewed by extreme outliers.
- Compa-ratio vs. range penetration: Compa-ratio pinpoints position against a target midpoint; range penetration measures headroom remaining before hitting a pay ceiling.
- Accuracy requires active bands: Metrics depend entirely on underlying data, which is why platforms like Figures keep salary range midpoints aligned with real-time market movement.
What is a compa-ratio?

A compa-ratio (short for comparative ratio) is a compensation metric that measures an employee’s base salary as a percentage of the midpoint of their assigned salary range. A compa-ratio of 100% means the employee is paid exactly at the range midpoint.
A critical distinction HR teams often miss: the denominator in a compa-ratio calculation is always the internal salary range midpoint, not a live market benchmark or industry median. While your salary range midpoint should ideally align with live market data, the compa-ratio itself evaluates position within your internal pay structure.
The numerator uses base salary alone. It excludes variable pay, annual bonuses, equity, or benefits, giving you a clean, isolated view of fixed cash compensation against your established pay bands.
Knowing an employee’s compa-ratio tells you immediately whether they sit above, below, or directly on target for their specific level and role, forming the baseline for defensible compensation decisions.
How do you calculate a compa-ratio?
To calculate a compa-ratio, divide an employee’s base salary by the midpoint of their salary range, then multiply by 100.
Compa-Ratio = Employee Base Salary/Salary Range Midpoint x 100
Here’s a working example:
Take a Senior Marketing Specialist earning a base salary of £50,000, where your company’s internal salary band for that level spans from £48,000 to £72,000, placing the range midpoint at £60,000.
Compa-Ratio = £50,000/£60,000 x 100 = 83.3%
At 83.3%, this employee sits significantly below the target midpoint, indicating they are either relatively new to the role or underpaid relative to your internal pay structure.

⚠️ In Excel or Sheets it’s the same sum in a cell: =base/midpoint, formatted as a percentage.
How do you read a compa-ratio percentage?
A compa-ratio of 100% means an employee is paid exactly at their salary range midpoint. However, 100% is a benchmark, not an automatic stamp of fairness.
Whether 100% is the “right” figure depends entirely on an employee’s tenure, performance, and your company’s broader compensation philosophy.
While exact boundaries vary across organisations, most HR teams interpret compa-ratio percentages using three common working bands within a standard 80% to 120% pay range:
- 80% to 89% (Developing / Emerging): Typical for recent hires, employees newly promoted into a level, or those still acquiring core competencies. If a high performer remains in this band for long, they represent a significant flight risk.
- 90% to 110% (Fully Competent / Target Band): The standard range for fully proficient employees meeting all performance expectations. Some organisations define this core band tightly at 95%-105%, while others use 90%-110%.
- 110% to 120%+ (Specialist / High Tenure): Applies to top performers, critical subject matter experts, or long-tenured staff who consistently exceed expectations but have no immediate path for upward promotion.

⚠️ Below 80% of midpoint usually points to a recent starter still learning the role, or someone underpaid against the band. On its own, a compa-ratio still cannot tell you whether pay is equitable. An employee at 85% might be appropriately placed if they started last month, but underpaid if they have been outperforming expectations for two years.
Similarly, if your salary bands are outdated compared to real-time market rates, a 100% compa-ratio might hide the fact that your pay is actually lagging behind competitors. Ultimately, setting target compa-ratios is a strategic policy choice – one that must balance internal equity, performance culture, and market competitiveness.
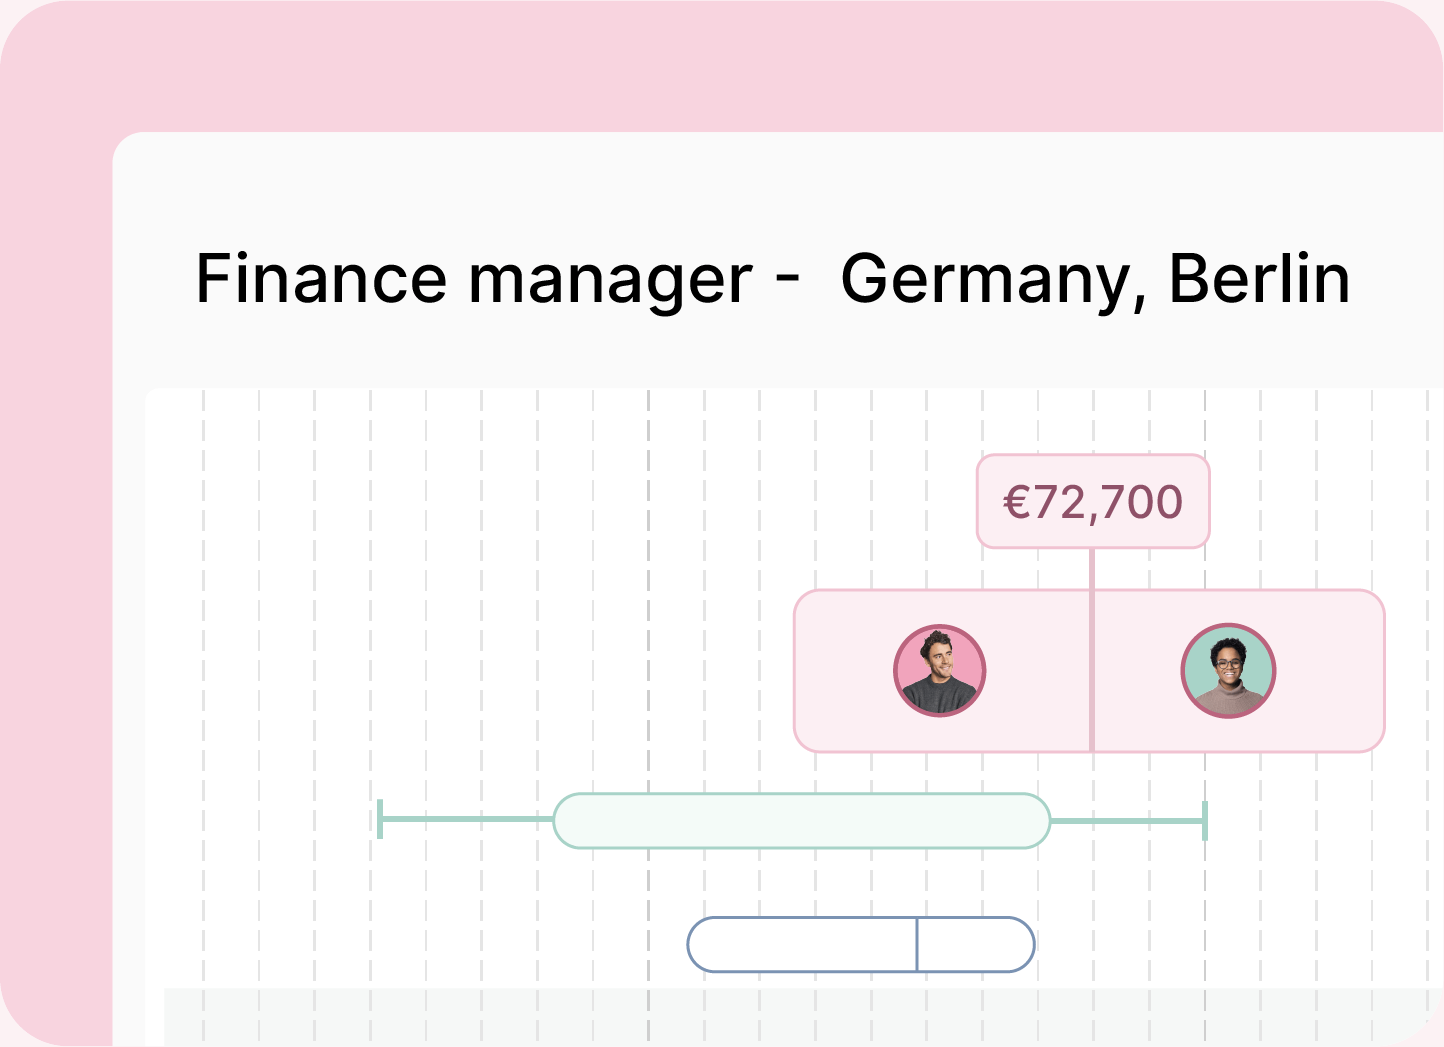
Build salary bands that hold up to scrutiny and keep pace with UK and EU market data.
Discover salary bandsWhat are the types of compa-ratios?
While most HR managers focus on individual figures, compa-ratios operate across three distinct levels to evaluate pay equity and budget alignment.
- Individual compa-ratio: Evaluates one employee’s base salary against the midpoint of their assigned salary range. This provides the granular data needed to make individual pay adjustment decisions during performance reviews.
- Group (or departmental) compa-ratio: Calculated by dividing the sum of all actual base salaries in a team, department, or company by the sum of all their respective range midpoints.
- Average compa-ratio: The simple arithmetic mean of all individual compa-ratios across a specific group.
When reviewing an entire team or function, the Group Compa-Ratio is significantly more useful than the Average Compa-Ratio.
Group Compa-Ratio = Base Salaries/Range Midpoints x 100
Simple averages treat every employee equally, meaning an entry-level employee’s extreme outlier ratio can distort the overall picture. In contrast, the Group Compa-Ratio weights pay according to total cash expenditure.
“This gives C&B managers and Heads of HR an accurate view of overall budget health, helping them spot whether an entire department – like Engineering or Sales – is systematically over- or under-positioned against your compensation policy without getting misled by statistical noise.” – Virgile Raingeard, Figures CEO
How is compa-ratio different from range penetration?
While both metrics assess an employee’s position within a salary band, they do so from entirely different angles:
- Compa-ratio measures distance from the range midpoint. It answers: “How close is this employee to our target pay rate for this level?”
- Range penetration measures progress across the entire salary range from minimum to maximum. It answers: “How much room does this employee have left to grow before hitting the band ceiling?”
To see how this works in practice, take two employees in a wide salary band spanning £40,000 to £80,000 (midpoint £60,000).
An employee earning £50,000 has a compa-ratio of 83.3% (£50k/£60k), but their range penetration is 25% ([£50k - £40k] / [£80k - £40k]).
⚠️While compa-ratio gives a quick snapshot for budgeting, range penetration is better for tracking progression within wide or overlapping bands.
For a complete breakdown of when to deploy each calculation, read our in-depth guide on salary range penetration.
Tracking and acting on compa-ratios with Figures
A compa-ratio pinpoints an employee’s exact position against a salary band, but it cannot single-handedly determine if pay is fair. Evaluating whether a figure is defensible requires reading it alongside performance ratings, tenure, and your organisation’s compensation policy.
More importantly, a compa-ratio is only as accurate as the range midpoint behind it. If your salary bands sit unadjusted while the market moves, a “perfect” 100% compa-ratio merely conceals the fact that your pay structure is lagging behind competitors. This is where manual spreadsheet management breaks down – and where modern compensation software pays off.
Figures is a compensation management platform that automates the entire compensation lifecycle for European companies. By combining real-time market data with automated workflows, Figures keeps your internal pay structures accurate and puts compa-ratio to work in every pay decision:
- Real-time market alignment: Connect your salary bands directly to fresh market intelligence, ensuring range midpoints reflect real hiring conditions rather than outdated annual surveys.
- Raise recommendations based on compa-ratio: Set compa-ratio as a rule in your compensation review configuration, so Figures prioritises raises for employees below a threshold you choose, such as 0.95.
- The effect of each raise on the band: See every employee's compa-ratio before and after their proposed raise, and how far it moves them within their salary band.
- At-risk employees, spotted early: Sort and filter your whole workforce by compa-ratio to find people sitting well below midpoint, and see each employee's current compa-ratio on their profile.
- Streamlined pay equity: Understand how salary bands drive pay equity across departments, surfacing hidden gender pay gaps and compliance risks before they trigger regulatory thresholds.

👀 Coming soon: compa-ratio guardrails for offers. Offers with a compa-ratio between 0.95 and 1.05 can be approved automatically, while anything outside that range goes through approval, with alerts when an offer breaks your rules. Figures is also adding analytics dashboards where you can chart compa-ratio alongside other pay metrics.
Instead of wrestling with static spreadsheets and stale midpoints, you can run fair, transparent, and fully compliant pay reviews with confidence.
💡Ready to see how automated salary bands and real-time benchmarking transform your pay strategy?
{{ cta_banner }}

Summarize this article with AI
No time to read it all? Get a clear, structured, and actionable summary in one click.




See how Figures keeps your salary bands aligned with market data to make every pay decision defensible.
Book a Figures demo