Key points:
- The formula is simple, but the preparation is complex: While the calculation itself is straightforward, gathering clean data, standardising hourly rates, and handling edge cases takes serious effort.
- Manual calculations work once, but automation scales: Spreadsheets handle your first report, but managing multiple years, countries, and regulatory changes demands proper software that maintains consistency and audit trails.
- Documentation beats calculation: Regulators care less about your 13.9% gap than your ability to explain it. Track every methodology decision because year-over-year questions will come.
Unless you’ve had your head in the sand, you should know that if your company has 250+ employees anywhere in Europe, annual gender pay gap reporting isn't optional anymore.
And if you're like 82% of companies joining Figures, your current gaps probably exceed the regulatory thresholds coming in 2026. That’s why you need to start calculating your pay gaps now rather than later. That way, you’ve got time to check that your numbers are right, because if they’re not, the EU will come-a-knocking with compliance penalties.
For many companies, getting calculations wrong is usually an honest mistake, born out of inexperience and lack of knowledge regarding the basic formulas that will help you build an accurate report.
That’s why in this guide, we’ll break down the exact formulas required for UK and EU compliance, plus explain the key decisions that ensure accurate calculations. We'll guide you through each choice so you can report with confidence. Let’s get started.
The gender pay gap calculation formula
Now for the formula itself. We’ll use “TechCo” as an example throughout, a fictional company that we’ve made up to show you what these calculations would look like for a “real” company. Any resemblance to real companies or entities is purely coincidental, yadda, yadda, yadda…
Do bear in mind, this guide covers both UK and EU requirements, which differ. The UK has prescriptive rules requiring specific calculations. The EU Pay Transparency Directive sets minimum standards but leaves implementation details to member states. We'll clearly mark which requirements apply to each jurisdiction throughout.
1. Collect and standardise your data
Before you touch a calculator, you need clean, comparable data for every employee. This is where most calculations go wrong. Not in the maths, but in the preparation.
Start with gross hourly rates, not annual salaries. Why? Because comparing a part-time administrator's €20,000 salary to a full-time manager's €60,000 tells you nothing useful. You need apples-to-apples comparisons.
For UK reporting, you must use gross hourly rates, not annual salaries. The EU directive doesn't specify this – member states may allow FTE conversions or other approaches – but hourly rates remain the most accurate method for comparing part-time and full-time workers.
Let’s walk you through this with TechCo, a 200-employee software company in Berlin, preparing for its first EU report:
- Extract compensation data: TechCo pulls all employee records from their HRIS, capturing base pay, car allowances, and location allowances for their Berlin and Munich offices.
- Convert to hourly rates: Their CFO earns €100,000 annually with contracted hours of 1,950 (37.5 hours × 52 weeks). The hourly rate? €51.28. Their part-time UX designer on €45,000 for 20 hours weekly? €43.27 per hour.
- Handle allowances correctly: Regular allowances stay in, overtime payments come out. As a tech company, TechCo has an on-call DevOps team with A €5,000 allowance. That allowance, because it’s regular, would be included in the pay gap report.
💡Pro tip: Check your jurisdiction's specific rules on employee exclusions. UK guidance typically excludes anyone on reduced pay due to taking leave during the snapshot period. Document your exclusion criteria carefully.
2. Calculate average pay by gender
Now for the straightforward bit: the actual calculation. But even here, the method you choose tells a different story about your organisation.
Add up all hourly rates for each gender, then divide by the headcount. Simple, but sensitive to outliers.
Here's how TechCo's numbers break down:
- Male employees (320 total): Sum of hourly rates = €11,520. Mean = €36.00 per hour.
- Female employees (172 total): Sum of hourly rates = €5,332. Mean = €31.00 per hour.
But wait: TechCo also needs the median for compliance:
- Median for men: Line up all 320 men by hourly pay. The middle person (160th and 161st averaged) earns €34.50.
- Median for women: Same process for 172 women. The middle person earns €32.00.
Notice something interesting?
TechCo's mean gap (13.9%) is nearly double their median gap (7.2%). When mean and median diverge significantly like this, it indicates that higher earners are pulling the average in one direction. In TechCo's specific case, we can see that three male C-suite members earning €90+ per hour contribute to this difference.
Different organisations will find different patterns. The key is to investigate what's driving your specific numbers rather than assuming a single cause.
🤔 For UK reporting and the EU's Pay Transparency Directive, you’ll need to calculate both mean and median gaps. We’ll show you how to do that next.
3. Apply the gender pay gap formula
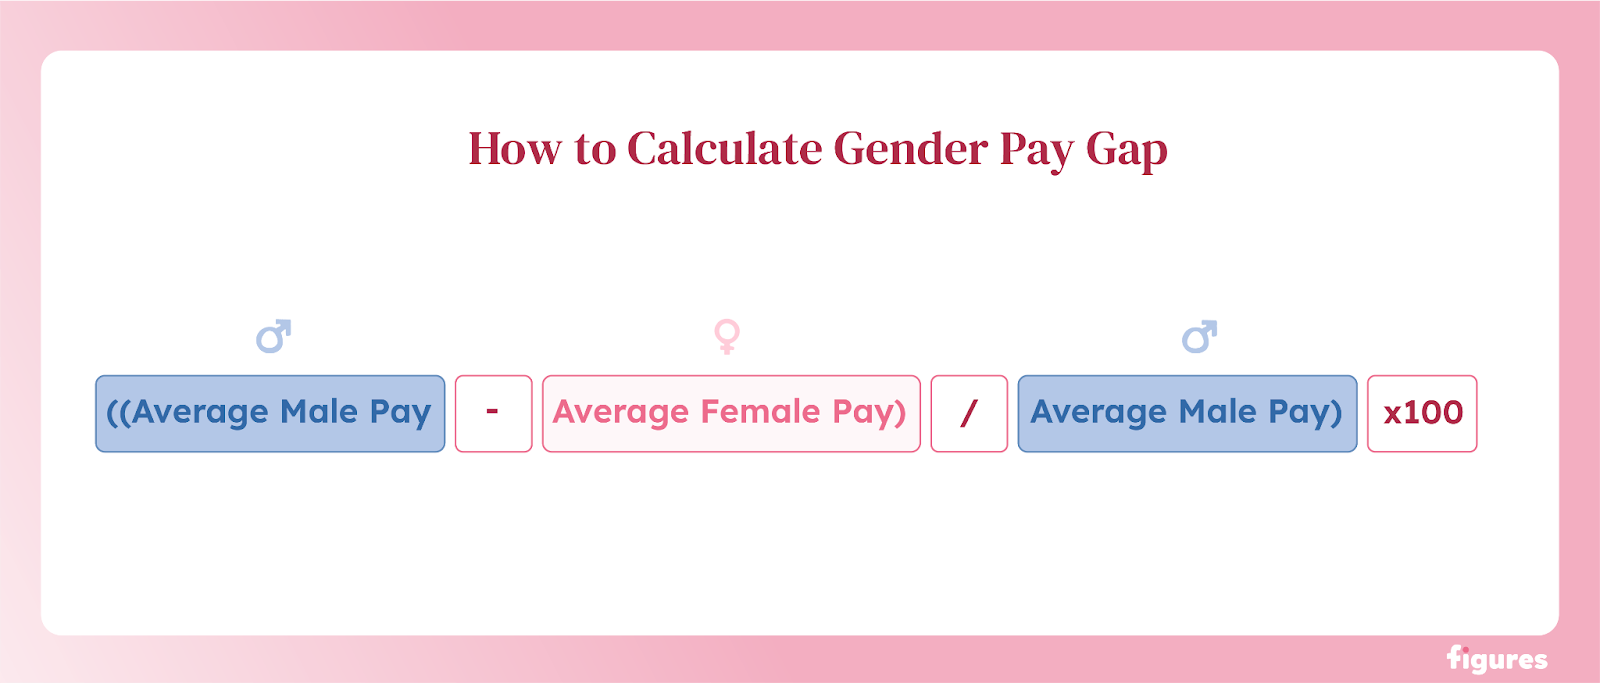
Time for the formula itself. This takes 30 seconds to apply, but carries months of scrutiny. Here it is: ((Average Male Pay - Average Female Pay) / Average Male Pay) × 100.
Let's recalculate TechCo's Berlin office figures in euros:
Mean calculation:
- Male average: €36.00 per hour
- Female average: €31.00 per hour
- Gap: ((36 - 31) ÷ 36) × 100 = 13.9%
Median calculation:
- Male median: €34.50 per hour
- Female median: €32.00 per hour
- Gap: ((34.50 - 32) ÷ 34.50) × 100 = 7.2%
A positive percentage means men earn more on average, which is the case for most organisations.
But what if your result comes out negative?
That's women earning more than men on average. Rare, but it happens, usually in specialised sectors or smaller companies where a few senior women shift the entire calculation. TechCo's design team actually shows a -3% gap (favouring women) when calculated separately.
‼️Critical compliance note: UK companies use a snapshot date of 5 April annually.
Remember: you're not calculating one gap, you're calculating at least two (mean and median), possibly six if you're including bonus gaps for UK reporting.
4. Segment and report your results
The basic calculation is done, but regulators want the full story. That means breaking down your workforce to show where gaps really hide.
This is where quartile distribution can help you expose the real problem. Split all employees into four pay bands and calculate gender balance in each. This is where TechCo discovered its biggest issue:
- Lower quartile (€15-25/hour): 68% women, 32% men
- Lower middle (€25-35/hour): 55% women, 45% men
- Upper middle (€35-50/hour): 41% women, 59% men
- Upper quartile (€50+/hour): 22% women, 78% men
See the pattern? Women represent a higher percentage in lower-paid quartiles and a lower percentage in higher-paid quartiles. This typically indicates two issues:
- Leadership gaps: Women not advancing to senior positions.
- Occupational segregation: Women concentrated in lower-paid functions (admin, support) while men dominate higher-paid areas (technical, commercial).
For TechCo, both factors likely contribute to their 13.9% mean gap, but determining which matters more requires analysing promotion rates and departmental distribution.
Now tackle bonus gaps… often worse than salary gaps.
TechCo's bonus calculation revealed a 31% mean gap:
- Male mean bonus: €8,500
- Female mean bonus: €5,865
- Gap: ((8,500 - 5,865) ÷ 8,500) × 100 = 31%
Why so high? This could be due to various factors - different bonus participation rates between genders, varying bonus percentages across roles, or the distribution of men and women across bonus-eligible positions. Without deeper analysis, we can't pinpoint the exact cause.
‼️Bonus participation rates are a metric that must be included as part of your EU pay transparency report.
Additionally, remember TechCo's 13.9% gap? Well, that means they're drafting explanations about "historical hiring patterns"... plus committing to concrete improvement targets.
TechCo might just be a figment of our imagination, but we’re still incredibly disappointed. Not angry, just disappointed. Granted, if they’re dedicated to their action plans, we’re willing to forgive them.
Mean vs median: which calculation method reveals your true gap?
Right, we know that you need to provide both mean and median pay gap calculations, but what do they actually reveal?
Mean calculation is sensitive to outliers. A handful of highly-paid employees of one gender can significantly affect your mean gap. When your mean and median diverge significantly, it indicates an uneven distribution of pay between genders.
On the other hand, we have median, which shows the middle value when all salaries are lined up. Line up all employees by pay, and find the middle person for each gender. This metric is less sensitive to extremely high or low salaries at either end of the pay scale.
Let’s say that TechCo did an analysis and found a 7% median gap but a 15% mean gap. What's happening? Equal pay for equal work at most levels, but their executive team? Eight men earning €120,000+, just two women at that level.
So, in this case, if women are regularly being passed up for promotion, even if they have the same qualifications and experience, the company needs a huge shakeup in priorities. Or an uprising… whatever comes first.
UK calculations and EU requirements
What calculations are required for gender pay gap reporting? The answer depends on where you operate, but UK companies should expect to calculate at least six different metrics.
The UK demands the most comprehensive reporting on the continent. That’s because companies in the UK must calculate:
- Mean hourly pay gap.
- Median hourly pay gap.
‼️EU territories also need to calculate the mean and median pay gap, just on an annual basis. However, this might vary by territory.
✅And the same metrics required for EU compliance:
- Mean bonus gap.
- Median bonus gap.
- Proportion receiving bonuses by gender.
- Quartile pay distribution.
That’s not even mentioning bonus requirements:
- Include all bonuses, commissions, and long-term incentives paid in your 12-month reference period.
- Calculate gaps using actual amounts received; never pro-rate for part-timers.
- Report participation rates separately (what percentage of each gender got any bonus at all).
EU requirements from June 2026
Let’s look at some requirements:
- Companies with 250+ employees face obligatory reporting on June 6, 2027, and must make subsequent reports annually.
- Companies with 150-249 employees are required to submit their first reports in June 2031, with subsequent reports every three years.
- Those under 100 employees are allowed to submit reports voluntarily (unless stated otherwise by territory).
- Report gaps by job category AND employee category (performing the same work, or work of equal value).
- Include benefits-in-kind valuation in total compensation.
- Most importantly: justify any gap exceeding 5% for affected employee categories with written action plans.
That last part is the most important, as the EU is actually expecting you to do something about any pay gaps you find. That stands in stark contrast to the UK, where they just want you to make these details public. It’s like a boyfriend telling you every red flag he has – but then never doing anything to actually address those issues.
Oh, and one more obstacle if you’re in the EU. Individual territory differences (Yay!). For example, France starts mandatory reporting at just 50 employees. Germany has its own Entgelttransparenzgesetz rules. Every country adds its own twist, making multi-national compliance a bit of a hassle.
Keep in mind that those regulations are what currently exist. We don’t yet know how they’ll change when the EU pay transparency directive comes into force. All we can really say is to stay tuned for more news…
Common calculation pitfalls that trigger compliance issues
Even experienced HR teams stumble over these calculation traps. One wrong assumption can invalidate months of work.
- Data quality problems: missing hours for part-time workers, outdated salary records, and manual calculation errors that automated systems prevent.
- Currency and location adjustments: Make sure to file your report in your territory’s currency.
- Pro-rating confusion: Never pro-rate hourly rates for part-time workers, but do pro-rate bonuses to full-time equivalent when calculating bonus gaps. This distinction trips up many first-time reporters.
The good news? Most pitfalls are predictable and preventable. Document every decision, automate where possible, and when in doubt, exclude rather than guess.
Building your calculation process for consistent reporting
Manual calculations work fine for your first report. By year three, when board members ask why the gap increased despite pay rises, you'll wish you'd built a proper system.
You can do this by creating a standardised data collection. Establish monthly data pulls from your HRIS, maintain consistent job architecture across reporting periods, and document any methodology changes that affect comparability. When TechCo switched from calendar to fiscal year reporting, their gap "jumped" 3% – purely from timing differences.
“Version control saves careers. Each reporting cycle brings questions about previous years' figures. Maintain clear audit trails showing exactly how each number was calculated.”
– Virgile Raingeard, CEO at Figures
Documentation practices that actually matter
- Record every methodology decision: Document what you decided (including apprentices), why (employment contracts require it), and the regulatory reference.
- Track assumptions that affect calculations: "Part-time hours based on contracted, not actual," "Bonuses allocated to paymen,t not performance date"—these details matter when year-over-year gaps shift unexpectedly.
- Create a change log: When gaps jump from 12% to 15%, you need to quickly identify whether it's methodology changes or actual pay movements.
- Prepare standard explanations: Document why "High mean, low median = leadership representation issue" and "Increased gap despite pay raises = more junior women hired." You'll need these repeatedly.
- Multi-jurisdiction complexity multiplies fast: Companies operating across EU countries face different thresholds, timelines, and calculation requirements. Systematisation becomes essential.
- Stakeholder communication templates prevent panic: Prepare explanations for common patterns before board meetings demand instant answers.
Moving from manual calculations to modern pay equity management
Well, you know how to calculate gender pay gaps ((Average Male Pay - Average Female Pay) / Average Male Pay) × 100. It’s easy to do… but if you’re using spreadsheets, you’re still going to hate your job.
That’s because manual calculations for 100+ employees across multiple countries, maintaining calculation consistency year-over-year, and documenting decisions for audit purposes, is a long and arduous job.
This complexity is why companies like Phiture use specialised platforms like Figures to "build full salary transparency structures" using systematic approaches. Our automated platform handles calculation complexity while maintaining the documentation trail that regulators demand.
Ready to see how leading European companies maintain calculation consistency while actually closing their gaps? Book a demo with Figures and discover what happens when pay equity management actually works.
{{ cta }}

Summarize this article with AI
No time to read it all? Get a clear, structured, and actionable summary in one click.