Key points:
- A gender pay gap is a useful headline number, but it doesn't tell you why it exists, or what to fix.
- Real pay equity analysis starts by comparing people doing work of equal value, not just people with the same job title.
- Legitimate factors like tenure, location or performance can explain part of a gap, but explained doesn't mean fair.
- Under the EU Pay Transparency Directive, a worker-category gap of 5% or more can trigger a joint pay assessment if the employer can't justify it.
- The same headline gap looks different at company, worker-category and individual level, and each level points to a different fix.
- Different causes (representation, individual pay decisions, flawed criteria) need different actions, there's rarely one single intervention.
A company can have a gender pay gap and still have fair pay practices. Equally, an organisation with little or no gap may still have unfairness hiding under the surface.
That’s because the gender pay gap is a broad measure. It’s useful as a high-level indicator, but it’s a blunt tool for understanding the intricacies of pay equity within an organisation.
For HR and compensation teams, the gender pay gap alone is not enough to determine a plan of action. After all, a large gap might be due to unfair pay practices that need to be rectified with increases for female employees. But it could also be an issue with promotion processes, representation across different roles, or simply how pay decisions have been made over time.
Without further analysis, it’s impossible to know. That’s why it’s worth looking underneath the headline number and working out what’s actually driving it before jumping to a fix.
Download the guide to understand gender pay gap analysis end to end, from the raw number to multi-linear regression.
Download the guideWhat your pay gap could be hiding
To help us understand this issue, let’s take a look at a fictional company: Aldera is a French employer with 1,240 employees across its offices in Paris and Lyon. As a large EU employer, it will be required to report on its gender pay gap under the EU Pay Transparency Directive.
After running an initial analysis, Aldera finds that it has an overall gender pay gap of 12%. Immediately, panic sets in. The company had previously thought its pay practices were fair, but that figure suggests something has gone badly wrong.
But while the 12% figure is useful, it only tells Aldera that women are earning less on average than men. It doesn’t explain why.
This leaves Aldera with a lot of questions: is the gap driven by the fact that more men hold senior, higher-paid roles? Are differences in tenure, location or experience playing a part? Are there pay differences between comparable employees that can’t be clearly explained? Or is there actual pay discrimination going on?
Those are very different situations — and the reality is that Aldera may be dealing with several of them at the same time. That’s why the headline figure is only the beginning of the analysis.
From gender pay gap to pay equity analysis
So how does Aldera get from a 12% headline gap to something it can actually act on? The first step is to stop treating all employees as one group and start looking at the factors that might be driving the difference.
Compare like with like
A company-wide gender pay gap compares the average pay of all women with the average pay of all men. A more useful comparison is between people doing the same work, or work of equal value.
And importantly, that doesn’t necessarily mean people with the same job title, in the same function or even in the same job family. Under the EU Pay Transparency Directive, work of equal value should be assessed using objective, gender-neutral criteria such as skills, effort, responsibility and working conditions.
So, for example, a customer service role and a software development role could potentially be placed in the same worker category if they are comparable when assessed against those criteria.
This is where job evaluation and classification become important. Employers need a consistent way to assess the value of different roles across the organisation, rather than simply relying on the organisational structure they already have.
Identify legitimate pay factors
Even within a group of comparable employees, you wouldn’t necessarily expect everyone to earn exactly the same amount.
For example, an employee with ten years’ experience might reasonably earn more than someone who joined two years ago. Location, relevant experience, scope of responsibility or performance may also affect pay. It all depends on how the company’s compensation system works.
The important part is whether those factors are genuinely relevant to the job, and whether they’re applied consistently.
Of course, just because a factor helps explain a pay difference doesn’t automatically make that difference fair. For example, if seniority accounts for much of the gap, for example, it may still be worth asking why men are more likely to reach senior positions in the first place.
Explained vs unexplained differences
Once you account for relevant factors, you can start to see how much of the gap they explain — and what’s still left over. The explained difference is the portion associated with factors such as level, tenure, location or job family. The unexplained difference is what remains after those factors have been considered.
Neither should be treated as a verdict on fairness. An explained difference may indicate a problem elsewhere in the organisation, such as biased promotion patterns or inconsistent performance decisions. An unexplained difference simply tells you that the factors you’ve looked at don’t account for it, so there is more to investigate.
Explained doesn’t mean fair. Unexplained doesn’t mean discrimination.
An explained gap may still reflect biased processes. An unexplained gap simply means there’s more to investigate.
Back to Aldera: what the 12% gap looks like underneath
When Aldera digs into its 12% company-wide gap, the picture starts to change. The same headline number looks quite different depending on where you zoom in.
Company level
At Aldera, men earn an average of €52,000 and women €45,800 — giving us that headline gap of 12%. But much of that difference comes from the fact that men and women are concentrated in different roles: men are more heavily represented in senior and higher-paid positions.
Once Aldera takes factors such as job level, job family, tenure and location into account, the unexplained part of the overall gap falls to around 4%. Again, that doesn’t mean that the “explained” part of the gap is fair — it would definitely be worth looking at why the company doesn’t have more women in senior positions. But it does mean that it’s not as simple as “women are paid less than men”.
Worker-category level
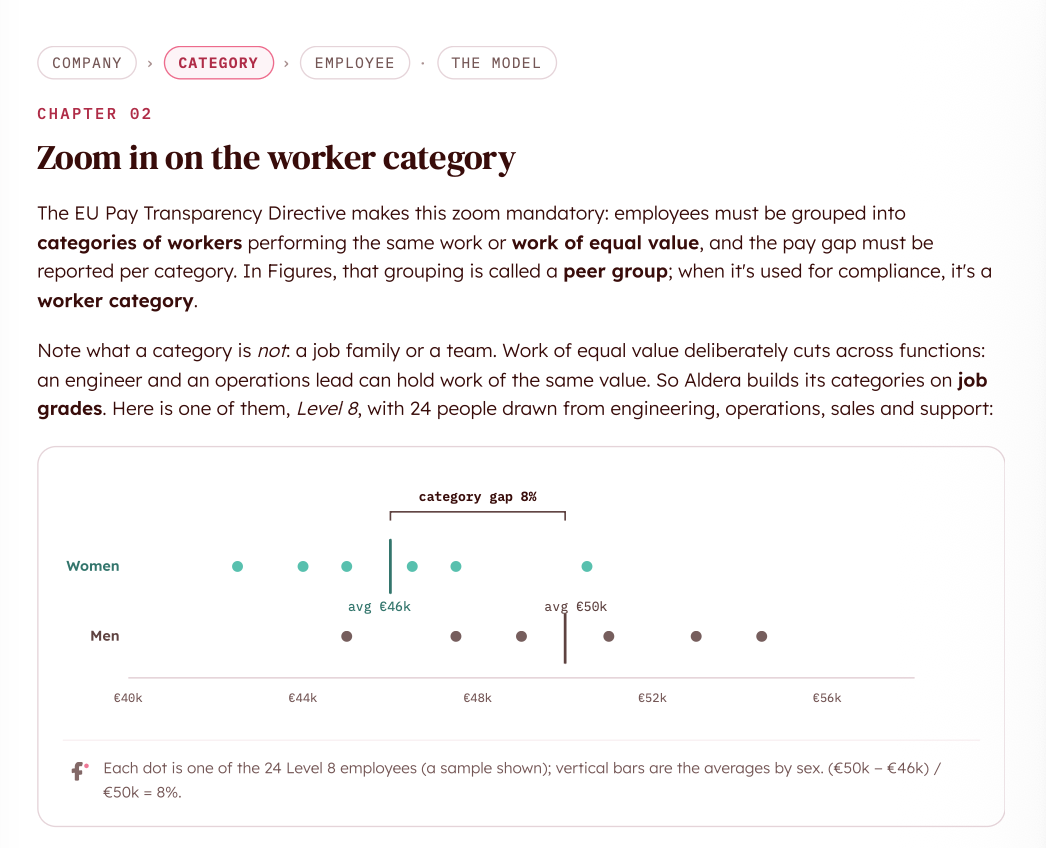
Zoom in on one worker category at Aldera, and the gap is 8%, with women earning less than men on average.
But part of that difference is linked to women in the category having less tenure on average and being more concentrated in lower-paying job families. Once those factors are taken into account, around five percentage points can be explained, leaving an unexplained gap of roughly 3%.
Under the EU Pay Transparency Directive, a worker-category gap of 5% or more can lead to a joint pay assessment with workers’ representatives if the employer can’t justify the difference using objective, gender-neutral criteria and doesn’t remedy the unjustified gap within six months.
Aldera’s raw category gap is 8%, so it crosses that initial threshold. But its analysis shows that around five percentage points of the difference can be explained by factors such as tenure and job family, leaving roughly 3% unexplained. If Aldera can demonstrate that those factors are genuinely objective, gender-neutral and applied fairly, that justification would be relevant to whether a joint pay assessment is required.
Individual level
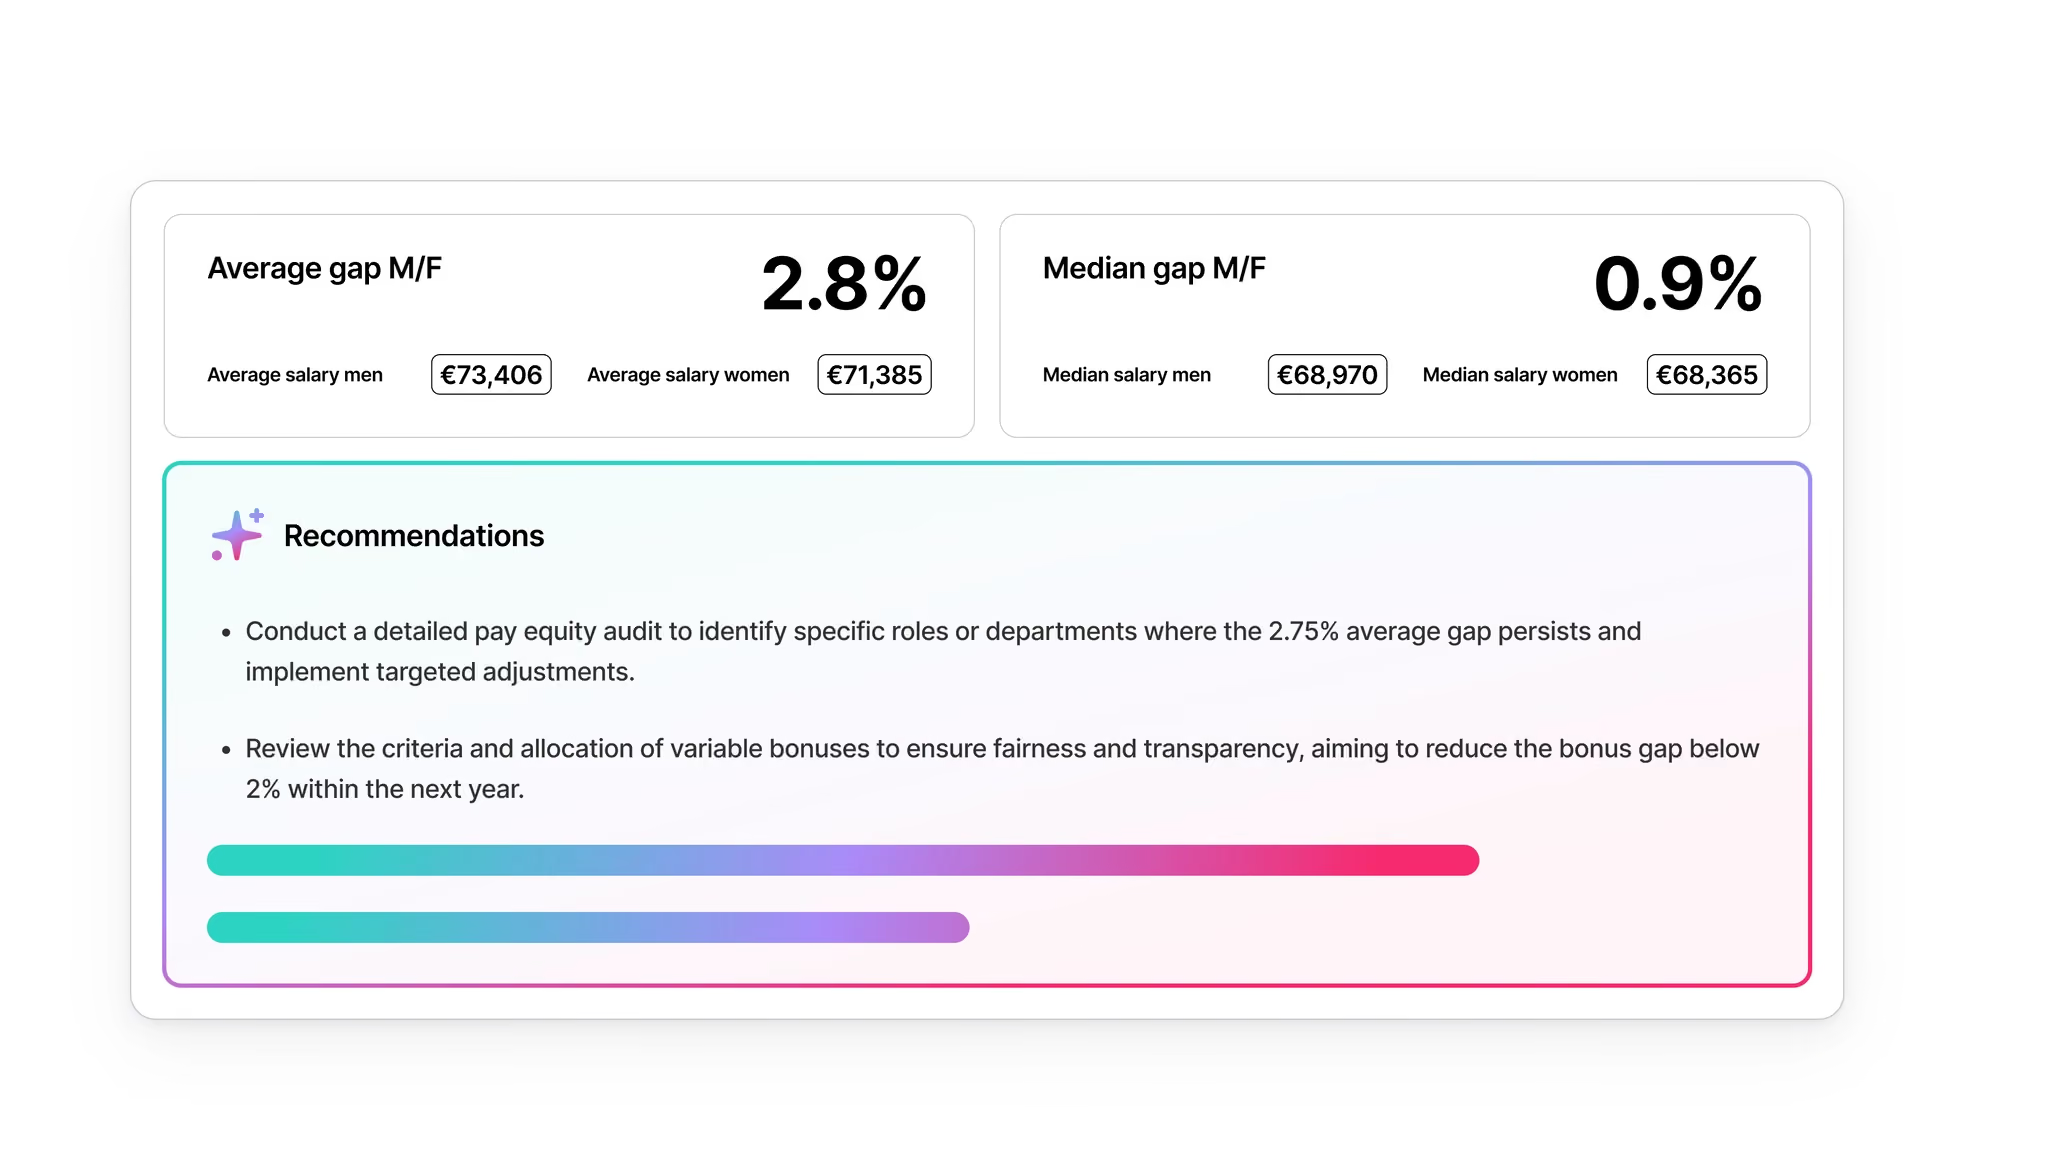
Then there’s Marie-Claire, an employee in that worker category. When she files a request for information about her pay — a right under the Pay Transparency Directive — she finds that the average salary for employees in her worker group is €50,000.
Marie-Claure only earns €46,000, meaning she appears to be 8% behind her peers. But this can easily be explained too: Marie-Claire has only two years’ tenure, compared with an average of around six years across the category. Once differences like tenure are taken into account, Aldera’s analysis predicts pay of around €48,000 for someone with her characteristics.
That €48,000 isn’t a recommendation for what Marie-Claire should be paid. It simply reflects what Aldera’s existing pay patterns would predict. Even after accounting for those differences, though, around 4% remains unexplained — and that is something Aldera would want to investigate further.
Different causes need different fixes
The figures above don’t tell Aldera exactly which pay differences are justified and which need correcting. But they do give the company a much clearer idea of where to look next.
The company-wide gap points heavily towards a representation issue, while the remaining unexplained gaps at category and individual level may need closer investigation. Those are different problems, which means Aldera shouldn’t expect one single intervention to solve them all.
The table below shows how different findings can point to different areas for HR to investigate or change.
How to go deeper into your pay equity analysis
Pay equity analysis can get complicated — what we’ve covered here is just the high-level version. In practice, going deeper means using statistical analysis to see how factors such as level, tenure, location and job family affect pay — and what’s still left unexplained.
If you want to see how that works in practice, Virgile Raingeard, co-founder and CEO of Figures, breaks the process down step by step in our downloadable guide to pay equity. Using the Aldera example, he walks through the company-wide gap, worker-category analysis, individual pay comparisons and the methodology behind adjusted pay gaps.
Download the full pay equity guide to learn more.
Download the guide to understand gender pay gap analysis end to end, from the raw number to multi-linear regression.
Download the guide