Key points:
- Real-time data beats annual surveys: Traditional salary surveys lag 12-18 months behind market reality. Modern benchmarking uses live HRIS data updated monthly for accurate compensation decisions.
- Precision filters matter: A "Software Engineer" salary can vary by €20,000+ based on specialisation, location, and company size. Specific role definitions lead to defensible salary ranges.
- The 15-minute market rate formula: Define the role precisely, gather location and industry data, choose your percentile position (25th, 50th, or 75th), then adjust for benefits and equity.
- Fair pay drives performance: Research shows workers feel more productive when they believe they are paid fairly. Trust in compensation directly impacts engagement.
- Manual methods create pay gaps: 82% of companies have gender pay gaps that won't meet 2026 EU regulations. Automated benchmarking prevents inequity before it starts.
Every HR leader aims to make compensation decisions that are fair, competitive, and strategic. After all, it’s the biggest factor when hiring new talent and retaining the talent you have. There is a trick, however: finding a salary number you can truly stand behind – one that satisfies the hiring manager, the candidate, and the CFO?
Stop what you’re doing. We see you opening a new tab, your fingers itching to type out ‘Glassdoor’. Honestly, it’s not a bad place to start, but that shouldn’t be your be-all-end-all. Especially when Glassdoor doesn’t have entirely accurate salary estimates.
What if we were to tell you there’s a way to get an accurate picture of market-rate salaries? A modern, data-driven approach to calculating market-rate salaries (Figures by name and nature).
If that sounds like your cup of tea, come along as we cover the essential factors, a step-by-step process, and how to build a compensation strategy that is both competitive and fair.
The old way vs. the new way of salary benchmarking
Before we compare methods, let's make one thing clear. A competitive salary doesn’t mean matching the highest offer. We can hear your hiring managers cheering from here.
Instead, you need to find a sweet spot that allows you to attract, motivate, and retain the right talent. Most of the time, that just means a rate that’s considered fair… one of our favourite words, that.
This sense of fairness is directly linked to performance. Research shows that 81% of workers feel more productive when they believe they are paid fairly. When employees trust that their compensation reflects both their contribution and market reality, engagement naturally follows.
Finding out what’s fair can be difficult, however. It requires you to benchmark your salary against similar roles and locations, which can be easier said than done.
The pitfalls of traditional benchmarking methods
As an HR rep, you might be thinking: “I know! An annual salary survey will give me the market data I need for an accurate benchmark!” Our sweet Summer child… before you shell out the cash, let’s explain why this isn’t always the best option. Annual salary surveys are often:
- Expensive: these surveys cost a lot, especially as they usually require a lot of time and expertise to carry out.
- Outdated: remember that time point? Well, that can cause issues with accuracy. By the time a survey is done, salaries may be wildly different, making benchmarking useless.
- Lacking specificity: job roles are poorly defined, as a Senior DevOps engineer might have different responsibilities in one company than another, which will affect compensation.
- Lacking context: No details on company size, industry nuances, location differences, or skill factors.
And that’s not even mentioning the small sample sizes. For the cost of these surveys, they aren’t worth their salt.
We can see the way your mind is working. You’re thinking about Glassdoor again, aren’t you? While a tempting (and cheap!) idea, online aggregators won’t be much of a help either.
That’s because they often have the same inaccuracies as annual salary surveys, especially as they rely on self-reported data.
Fact is, if you’re using either of these methods, you’re still going to be making salary decisions based on gut instinct. There’s a better way, however.
The modern approach: real-time, contextual data
The most reliable way to determine a market rate is to use fresh, aggregated data from real companies. No surveys, no self-reporting – just facts.
This means drawing directly from live Human Resources Information Systems (HRIS), where actual salary information is stored and updated with every payroll run.
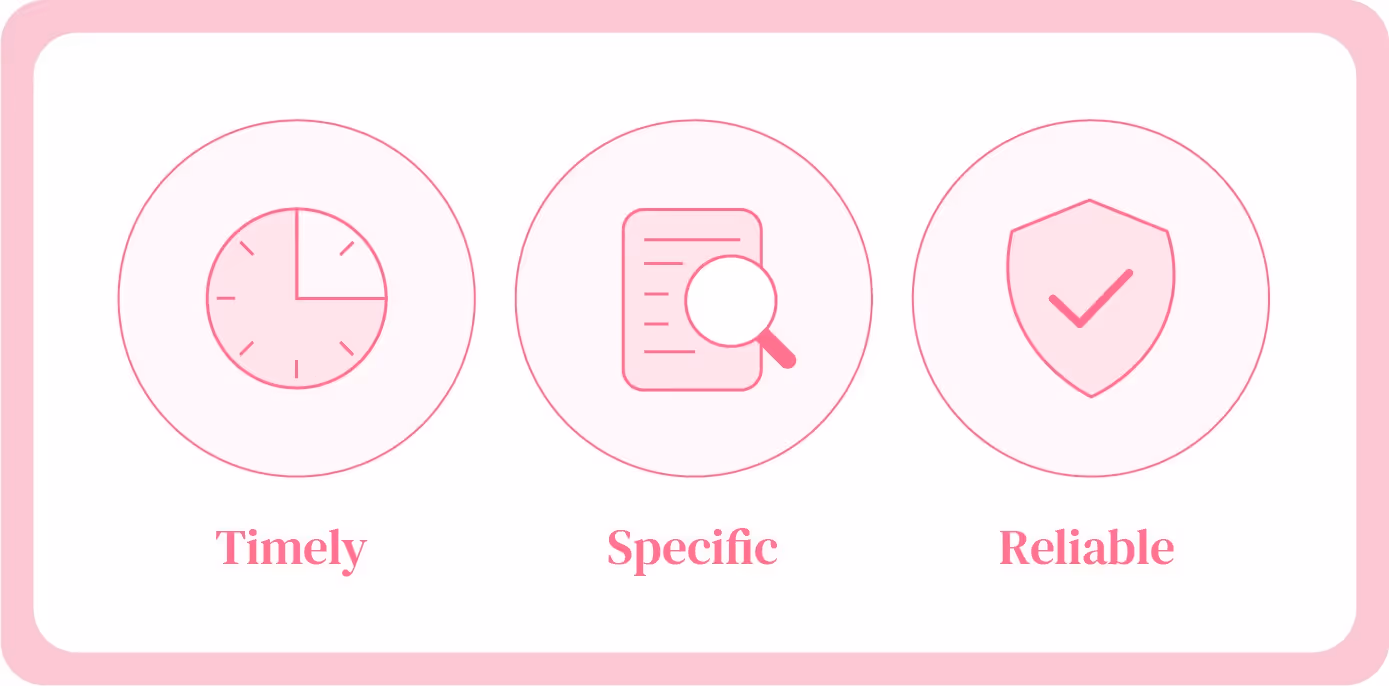
This approach gives you data that is:
- Timely: updated monthly, not annually. Markets shift fast – what was competitive in January might be below par by June.
- Specific: filterable by city, industry, company size, and funding round. A Series B fintech in Amsterdam pays differently than an enterprise software company in Prague.
- Reliable: based on verified payroll data, not self-reported numbers. These are actual salaries being paid right now.
This stands in stark contrast to the other methods, which are either too slow or too unreliable to provide accurate numbers. And accuracy is the name of the game when you’re calculating market rate salaries.
“What matters is the quality of the data. Relying on self-reported salaries and outdated surveys will do more to harm your talent acquisition and retention efforts than they will to help them.”
– Virgile Raingeard, CEO at Figures
💡 The power of specificity: When you can tell your CFO, "This range comes from 47 comparable companies in our industry, updated last week, at the 60th percentile for our city," resistance melts away. Vague "market rate" claims trigger debate. Precise data ends it.
Now, let’s move on to actually calculating market rate salary.
A step-by-step guide to calculating a market rate salary
Market rate salary is a defensible range built from four filters: role specifics, cohort match, percentile selection, and reality adjustments. To calculate it, follow these steps:
Step 1: Define the role with precision
Look beyond the job title. A 'Software Engineer' can mean very different things.
Start with a levelling framework:
- Junior: 0-2 years, requires guidance, works on defined tasks
- Mid-level: 2-5 years, works independently, owns features
- Senior: 5+ years, leads projects, mentors others
- Lead: 8+ years, sets technical direction, influences strategy
Then nail down the specifics:
🤔 Did you know? Two "Senior Software Engineers" at the same company can have market rates that differ by €20,000+ based solely on their technical specialisation. A machine learning engineer typically commands 15-25% more than a frontend developer at the same level.
The clearer your definition, the more accurate your benchmark.
Step 2: Gather your key data points
Now for your key data points. These are very similar to what you’d have to include when calculating gender pay gaps. They are:
- Location: Be specific. The market rate in Paris is different from that in Lyon. Consider your remote and hybrid work policies.
- Industry: A Project Manager in a FinTech company will likely have a different market rate than one in the non-profit sector.
- Company Size and stage: A 200-person, venture-backed scale-up has a different compensation structure than a 5,000-person enterprise.
Once you’ve got your key data sets in hand, let’s move on to market positions.
Step 3: Choose your market position
Decide where you want to position your company in the market using percentiles:
- 25th percentile: Below the market average. Choose this when you offer exceptional learning opportunities, equity upside, or unmatched work-life balance. You’re aiming to offer better benefits here, rather than monetary value.
- 50th percentile (Median): Matches the market average. A common starting point. Most companies land here – you'll win some candidates, lose others, but stay competitive without breaking the budget.
- 75th percentile: Aims to pay more than most of the market, often used to attract top-tier talent. Reserved for critical roles or when competing against deep-pocketed rivals.
This is where you need to be smart. If you’re consistently paying in the lowest percentile, don’t expect super-motivated employees (unless you’ve got amazing benefits; we’re talking swimming pools and blackjack tables).
On the opposite end of the spectrum, if you’re paying premium compensation packages consistently, your CFO will likely want a word. Company budgets can only go so far, and while a well-paid employee is a happy one, they won’t be happy if they’re out of a job because a company has had to claim bankruptcy.
🤔Keep in mind, different pay results in bigger pay gaps. That’s why it’s a good idea to have compensation software that actively tracks any payment updates directly from your HRIS.
Step 4: Make the 'reality adjustment'
A salary is just one part of the total rewards package. But what about everything else outside of compensation, like:
- Benefits: Flexible working, health insurance, and paid time off. Worth 5-15% of base salary in perceived value. A €70,000 role with full remote flexibility might compete with an €80,000 office-only position.
- Variable pay: Potential bonuses or commission structures. Can add 10-30% to total comp. But remember: candidates often discount bonuses by 50% when evaluating offers. They've been burned before.
- Equity: Stock options can be a significant part of the compensation, especially in startups.
We’ve talked about stock options, but what about pay equity? Ensuring fairness internally (alongside your current team in similar roles) is just as important as being competitive externally.
If you want to be on the fast track for destroying morale, we dare you to pay a new hire more than your loyal three-year veteran in the same role. They’ll be job-seeking before you know it.
A market rate salary example
Let's put this into practice for a Project Manager with 5 years of experience at a fictional 200-employee SaaS company in Berlin (in our heads, it’s called Kiss My SaaS).
The old way: You might look at a generic report and find a broad range of €60,000-€85,000 for "Project Managers in Germany." This is too wide to be useful and doesn't account for your industry or company size.
So, what do you offer? €60,000 and risk losing the candidate? €85,000 and overpay? You're stuck guessing.
The modern, data-driven way: Using a real-time benchmarking tool, you would apply specific filters:
- Role: Project Manager.
- Level: Mid-Senior (correlating to 5 years' experience).
- Location: Berlin, Germany.
- Industry: SaaS (Tech).
- Company size: 151-250 employees.
The result is a much clearer picture:
This transforms salary research into a repeatable 15-minute process that produces three numbers you can defend: your floor, your target, and your stretch.
Now you have a defensible, data-backed range to inform your offer and build your salary band around. No more guessing, no more awkward negotiations starting from nowhere.
Of course, if you don’t want to do the math yourself, there’s always software that can do the calculations for you. Take Figures, for instance, which tracks salaries for different positions across the EU. You simply enter the positions you want to compare, percentiles, and locations, and the work is done for you.
And the best thing is that our salary database is continually updated, so you’ll always have the latest figures. Want to try this salary calculator for yourself? Get an app preview with Figures.
From a single salary to a fair compensation strategy
Calculating one salary is a challenge. Building a fair and consistent structure for 200 employees is an imperative. This is where manual methods break down, and the risk of pay inequity grows.
In fact, at Figures, we've found that 82% of companies that join us have pay gaps that would not be compliant with the upcoming 2026 EU regulations.
The solution: A modern compensation platform
- Live benchmarks: This is the foundation. A tool like Figures connects to your HRIS and provides monthly updated salary data from over 3.5 million data points (powered by Mercer) across Europe. It's fully GDPR compliant, ISO 27001 and SOC 2 certified, so your data is always secure.
- Structured salary bands: Turn those benchmarks into policy. You can create a clear, equitable grid for every role, level, and location in your company, eliminating guesswork.
- Streamlined compensation reviews: move away from complex, error-prone spreadsheets. Figures centralises the entire process, saving HR teams an average of three weeks of work and empowering managers to make fair, data-driven decisions.
- Proactive pay equity: get ahead of compliance. The EU Pay Transparency Directive requires companies to act if they find a gender pay gap of 5% or more. Figures gives you a clear dashboard to identify and resolve gaps, ensuring you're not just compliant, but a truly fair place to work.
"Too many companies are still reactive with compensation, waiting for an employee to complain or a competitor to poach their talent. A modern, proactive strategy uses live data not just to set a salary, but to build a transparent framework that fosters trust and drives performance."
– Virgile Raingeard, CEO, Figures
Ready to replace guesswork and start building?
Calculating a competitive market salary doesn't have to be a last-minute scramble based on questionable data. By embracing a real-time, data-driven approach, you can move with confidence, speed, and fairness.
Remember, you’re building a compensation strategy that attracts the right people, retains your top performers, and establishes your reputation as a fair and forward-thinking employer. But to do that, you’re going to benchmark against actual market data.
Join over 10,000 users and see for yourself how Figures can give you defensible salary numbers in minutes, streamline your compensation reviews, and ensure pay equity across your company.
"Before Figures, it could easily take us a week to benchmark a salary, but now we instantly have reliable, accurate benchmarking data."
– Lifen
Stop second-guessing. Start making compensation decisions backed by real data from real companies paying real salaries right now.
{{ cta }}
Frequently asked questions (FAQs)
Q: Where can I find market salary data?
You can find salary data in several places, but the quality and reliability vary significantly. Many people begin with publicly available sources, such as job boards (LinkedIn, Indeed) or government statistics (e.g., INSEE in France).
They’re a decent general baseline, but they often rely on self-reported data or broad averages that lack the specific context of company size, industry, or role seniority. You wouldn’t rely on bias and personal opinion in court, so why would you rely on it for market data?
You want a solution that’s entirely data-driven. A platform that provides real-time, verified benchmarks drawn directly from company HR systems. We’re kind of above needless self-promotion… in most instances.
Truth is, a platform like Figures is designed for this, allowing you to get a defensible salary range in minutes instead of relying on outdated, generic numbers.
Q: How does the cost of living affect a competitive salary?
While the cost of living (what it costs to live in an area) is a factor in terms of what salaries people will accept, companies should focus on the market rate (what it costs to hire a specific skill in that area). The market rate is driven by the local supply and demand for talent.
For example, a high cost of living in a city like Amsterdam (not even accounting for all the time you spend in the cafes) will certainly push the market rate up. However, intense competition for a few highly skilled software engineers could drive their market rate even higher, beyond what a simple cost-of-living adjustment would suggest. To be competitive, you need to benchmark against the local market rate, not just a cost-of-living formula.
Q: Why do salaries for similar roles vary so much between industries?
Salaries for the same job title, like 'Project Manager', can differ significantly across industries due to two main reasons: profitability and compensation structure.
- Profitability and talent demand: High-margin industries like tech and finance generate more revenue per employee and can afford to pay more, the lucky blighters. Granted, they also face intense competition for specialised talent, which further inflates salaries.
- Compensation structure: What makes up a "competitive" offer changes by sector.
- In tech, total compensation often includes a significant amount of equity (stock options), linking pay to long-term company growth.
- In finance or sales-driven roles, a large annual bonus tied to performance can make up a substantial part of the total package.
- Other sectors might offer lower variable pay but provide more stability or better benefits, such as generous pension plans.

Summarize this article with AI
No time to read it all? Get a clear, structured, and actionable summary in one click.