Key points:
- Three questions reveal tool quality: Where does this data come from? How well does it match my exact situation? How fresh is it really?
- Free tools create expensive mistakes: self-reported data from Glassdoor suffers from bias, potentially costing you thousands in bad hire replacements.
- Real-time beats annual surveys: legacy providers offer 6-12-month-old data for £8,000-85,000+, while modern platforms like Figures deliver monthly updates from £2,500/year.
- European companies need European solutions: US-heavy surveys miss local nuances – genuine European coverage means granular data for Berlin, Barcelona, and beyond.
- Evidence transforms conversations: Replace "market research suggests" with "According to real-time data from 127 similar European tech companies…" – proper tools give you the vocabulary to defend every decision.
- This guide breaks down over ten tools: From free recruiter guides to enterprise survey providers – so you can see exactly what each one costs, how often the data updates, and whether it actually covers the UK.
Ever compare three salary benchmarking tools only to get three wildly different numbers for the same role? You’re not alone. The market’s flooded with platforms promising “real-time data” and “competitive insights,” but most HR teams end up more confused than confident.
Here’s the good news: you don't need to test every platform yourself. Below, we've broken down over ten salary benchmarking tools side by side – what they cost in GBP, how fresh the data really is, and where each one falls short. We've also included the three questions that tell you, within minutes, whether any tool is worth your time.
Whether you're replacing a legacy survey, upgrading from Glassdoor guesswork, or choosing between two real-time platforms, this guide gives you the full picture – no demo calls required.
{{ ai }}
What salary benchmarking tools do
Salary benchmarking tools are platforms that compare your compensation packages against verified market data to produce defensible pay decisions.
But here’s the real magic: they solve a trust problem, not just a data problem. When you tell your CFO that a senior engineer needs a 10% raise, “I averaged three websites” is like telling your doctor, “I diagnosed myself on the internet.” You need credible, verifiable sources that stand up to scrutiny.
Think about the last time you relied on Glassdoor or informal networking to set salaries. The data varies wildly because it’s self-reported – people share salaries when they’re either thrilled or furious, rarely when they’re content. That engineering role showing £45,000 on one site and £75,000 on another? Neither number helps when you’re defending budget decisions to the board.
Modern benchmarking tools deliver something different: HRIS-verified data from real payroll systems, filtered by your exact criteria – role, level, location, company size. They provide the evidence you need to make fair, competitive offers that won't blow your budget or lose you talent.
Best salary benchmarking tools for 2026
Not all salary benchmarking tools are built the same. Some are free but limited; others pull real-time payroll data; a few carry the enterprise pedigree that gets budget sign-off from the board. The table below gives you a quick comparison – then we break each category down.
Free tools
Free salary benchmarking tools are the natural starting point – and for quick sense-checks, they do the job. The trade-off is transparency: most rely on recruiter placement data or self-reported figures, and none let you filter by company size, funding stage, or precise location.
- Michael Page Salary Guide publishes annual UK salary ranges across industries and functions. It's recruiter-sourced, so the data reflects what candidates actually accepted – not what they hoped for on a forum. Useful for a ballpark, less useful when you need to distinguish between a 200-person fintech in Manchester and a 2,000-person bank in London.
- Hays Salary Guide covers similar ground with a UK and Ireland focus. Their annual survey draws on thousands of employer and employee responses, making it one of the more robust free resources for sector-level benchmarks. It includes hiring trend data alongside salary ranges, which adds context that pure salary figures miss.
- BrightHR offers a free salary benchmarking tool aimed at UK SMEs. It pulls from ONS data and employer submissions, so it skews toward smaller companies – useful if that's your bracket, less so for pan-European roles.
- Robert Half Salary Guide is particularly strong for finance, technology, and administrative roles. Like Michael Page, it draws on recruiter placements. The annual guide includes a salary calculator that adjusts for UK city and experience level.
💡Recruiter-sourced salary guides reflect accepted offers – not aspirational figures. That makes them more grounded than self-reported platforms, but they still lag behind real-time payroll data by months.
Real-time platforms
Real-time platforms pull data directly from HRIS and payroll systems, so the numbers reflect what companies are actually paying right now – not what a survey captured six months ago. This category is where the market has shifted fastest.
Ravio
Ravio focuses on VC-backed technology companies in Europe. Their data is HRIS-verified and updated monthly, with strong coverage of engineering, product, and design roles. If your company is a Series A–C tech business, Ravio's peer set will feel familiar. Coverage thins out for non-tech sectors and larger enterprises.
Figures
Figures combines HRIS-verified employer data with 3.5 million Mercer data points, refreshed monthly. The platform covers the full compensation lifecycle in a single tool:
It also has SOC 2 Type 2, ISO 27001, and GDPR certification, so all your data is fully secure and compliant.
Figures is built for fast-growing European companies with 250–5,000 employees who need granular data across multiple countries. Where many tools offer "European coverage" that really means London plus rough continental estimates, Figures provides city-level depth for Berlin, Paris, Barcelona, Amsterdam, and beyond.
See how Figures benchmarks salaries across Europe → Book a demo
Pave
Pave is a US-first platform with a free tier that's attracted a large network of contributing companies. Real-time data and strong equity compensation benchmarking are its strengths. UK and European coverage is growing but remains thinner than US data – worth evaluating if you have significant US headcount alongside European teams.
HR Data Hub
HR Data Hub is a UK-focused benchmarking platform that collects data directly from employers. Quarterly updates and a straightforward interface make it a pragmatic choice for UK SMEs who need local data without enterprise pricing.
Enterprise providers
Enterprise survey providers carry decades of board-level credibility. When you present Mercer or Radford data to executives, nobody questions the source. The trade-off is cost, data freshness, and usability.
- Salary.com / CompAnalyst is a US-headquartered platform offering employer survey data with compensation planning tools built in. Strong for US roles; UK and European coverage is less granular. Pricing starts around £4,200/year for smaller packages.
- Mercer's direct survey products remain the gold standard for global enterprises. Their Total Remuneration Survey covers millions of data points across 130+ countries with deep industry cuts. As a standalone product, the annual publication cycle means you're typically working with data that's 6–12 months old, and pricing ranges from £8,500 for basic access to £85,000+ for fully customised packages.
- Radford (Aon) dominates technology sector compensation data globally. The Radford McLagan database covers nearly 9,000 organisations with over 30 million employees. Like Mercer, it's annual, enterprise-priced, and carries the credibility that makes CFOs nod rather than question. Best suited for large, established companies with the budget and internal resources to extract value from complex datasets.
💡Mercer data, without the wait: The same 3.5 million Mercer data points are available through the Figures x Mercer partnership. They are refreshed regularly and accessible inside a single platform that is fully integrated with your HRIS, rather than delivered as a static annual report. See how it works →
How to evaluate a salary benchmarking tool
Tools are foundational to any compensation strategy, but choosing between them feels like comparing apples to mystery fruit.
Now that you've seen what's available, here's how to stress-test any tool on the list – or any new one that lands in your inbox. Three questions cut straight to what matters.
1. Does the data match your company profile?
Relevance beats volume every time. A million data points mean nothing if none match your specific needs.
Start with precision: Can you filter for “Senior DevOps Engineer in Paris at a 200-person company?” If the answer involves creative workarounds or “close enough” compromises, keep looking.
Check the granularity that matters:
- Industry specificity – Tech compensation differs wildly from manufacturing.
- Location precision – "Europe" isn't enough when Berlin pays differently than Barcelona.
- Company size brackets – A 250-person company isn’t comparable to a 2,000-person enterprise.
- Data depth – Job families, experience levels, equity packages.
⚠️ Don’t forget compliance. European companies need GDPR-compliant platforms with proper data residency. Security certifications such as SOC 2 and ISO 27001 are essential when handling sensitive compensation data.
2. How trustworthy, recent, and comprehensive is the data?
Great benchmarking tools give you data that you can trust with confidence because they’re clear about their origin and level of reliability. In simple terms, you need data from accurate and up-to-date sources, so when you need information about the last quarter, that’s exactly what you’re getting.
What you need to remember is that HRIS-verified data beats self-reported numbers every time. When platforms pull directly from payroll systems, you get actual salaries, not hopeful estimates or angry exaggerations. Self-reported data? That’s like asking people their weight at the gym – expect creative interpretations.
Here’s why currency matters: using 12-month-old surveys when markets shift quarterly just doesn’t work. Hot skills command premiums overnight. That 6-month delay? It’s the difference between competitive offers and watching top talent join competitors who moved faster with fresher data.
3. Does the tool integrate with and simplify your workflow?
Even the fanciest platform becomes worthless if it doesn’t fit your reality. Watch out for these factors:
- Implementation timelines. Ask yourself honestly: “Can I get my first benchmark before my review meeting next week?” If onboarding takes months, you’ll miss critical decisions while learning the system.
- Customer support. Generic helpdesks that treat you like ticket #47,293? Pass. You need a dedicated team that understands compensation nuances and responds like actual humans who care about your success.
- Integration capabilities. Can it connect with your HRIS? Export to your preferred formats? Share insights with stakeholders who aren’t compensation experts?
"The best compensation tool is the one that doesn't make you feel like you need a PhD to use it," says Agnès Chauvigny, VP People at Figures. "You have actual work to do, not another system to master. You want to go from login to 'aha!' in minutes."
Free data vs. paid tools: when Glassdoor works and when you need more
Let’s be honest – we’ve all started our salary research journey the same way, but late-night Glassdoor scrolling is basically the compensation equivalent of WebMD-ing your symptoms.
Besides Glassdoor, other free resources include Indeed's salary tool and government databases. However, besides being “free” in the monetary sense, they’re also free of the context you need to defend them. In simple words, they don’t explain any of their findings, and without verification methods or filtering for company size and location specifics, you’re just not working with viable data.
Picture this scenario: you use Glassdoor data showing £45,000 for a developer role. Your competitor uses verified data showing the actual market rate is £55,000. Guess who gets the developer?
Or worse – you overpay based on inflated self-reported data. Glassdoor omits many compensation elements that employers factor in, meaning those numbers could be misleading in either direction. That “competitive” offer you made? It might have been way off the mark.
The ROI reality check: industry estimates put the total cost of replacing a single employee at six to nine months' salary – covering recruitment, onboarding, training, and the productivity gap while the new hire gets up to speed. For a £50,000 role, that's £25,000–£37,500 walking out the door. For specialised positions, some estimates run as high as four times the annual salary.
Compare that to a premium benchmarking platform, which typically ranges from £2,000 to £8,500 annually. It’s an investment that pays for itself with a single correctly-levelled hire – and saves you multiples of that cost by avoiding just one expensive recruitment mistake.
Here’s what’s even more sobering: the CIPD's Resourcing and Talent Planning Report 2022 found that only 17% of respondents calculated the cost of labour turnover. Most companies don’t even know how much bad data is costing them.
💡 If you think good data is expensive, try making decisions with bad data.
Transform your benchmarking strategy with Figures
Most compensation platforms force a choice: enterprise-grade data depth or a modern interface you can actually use. Figures x Mercer eliminates that trade-off – 3.5 million Mercer data points wrapped in a platform built for speed.
The combination solves a problem that's easy to overlook until you're mid-review cycle: most "European coverage" from US-first providers really means London data with rough continental estimates bolted on. Figures provides genuinely granular insights – city-level depth for Berlin, Paris, Barcelona, Amsterdam, and dozens of other European markets.
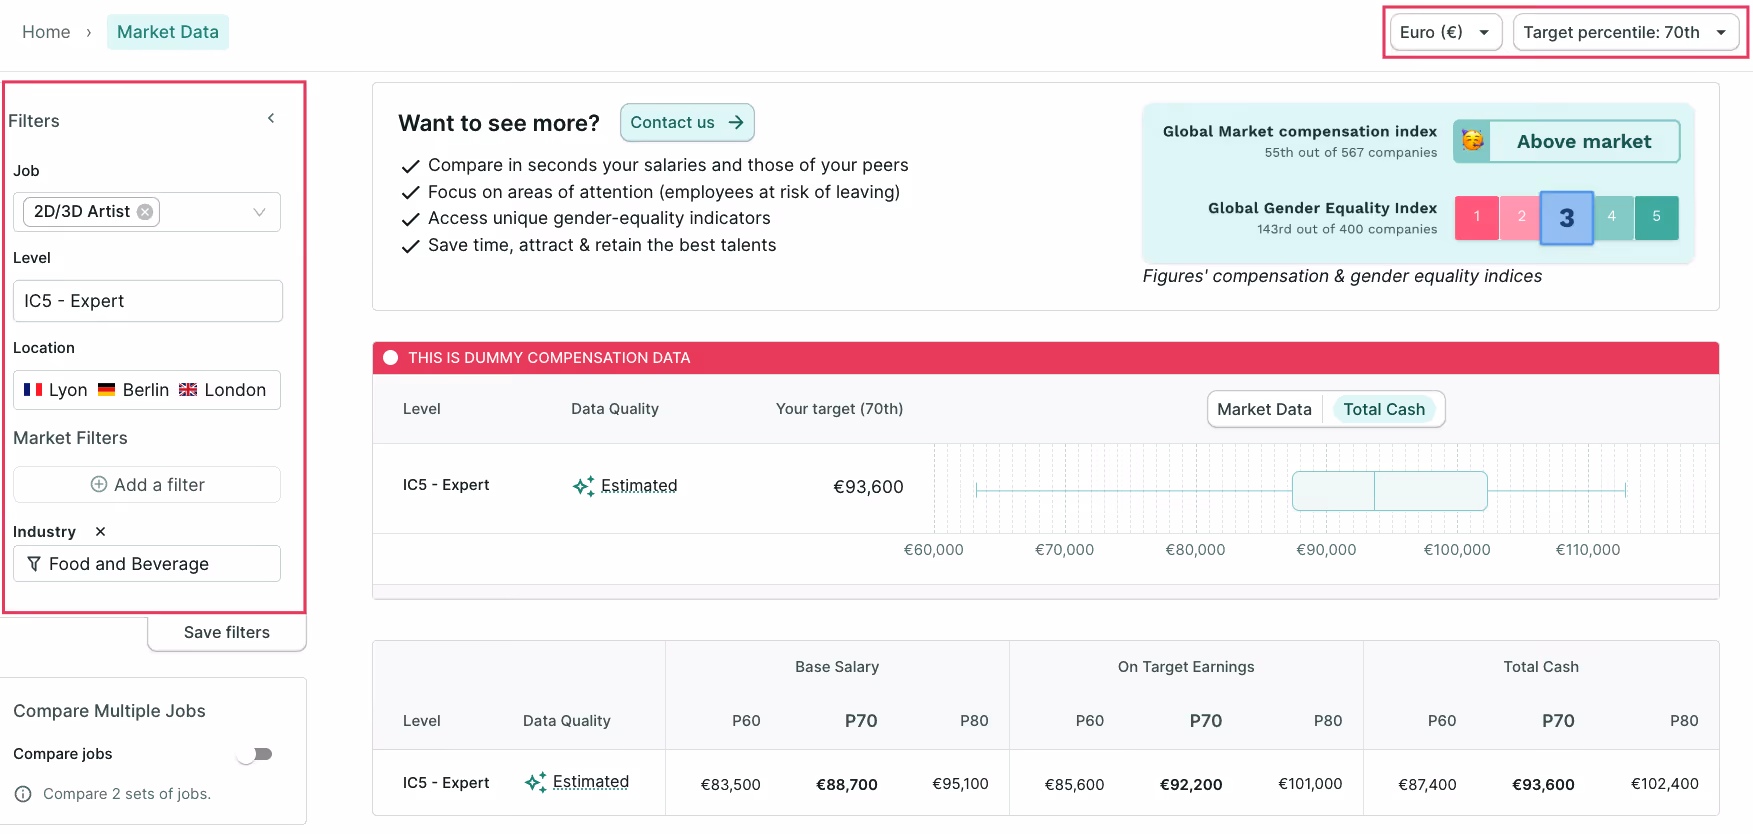
When you're benchmarking a product manager in Lyon against one in Munich, the data actually reflects those markets, not a blended "Western Europe" average.
"Instead of searching the World Wide Web for hours looking for compensation benchmarking data, Mansa finds reliable benchmarking data for the exact positions they are hiring for," shares Paul de Preville, VP Sales at Mansa.
However, benchmarking is just the beginning, and Figures manages the entire cycle of your employees – hiring, compensation reviews, salary adjustments, and even budget planning for the entire company. All of that is completely secure with SOC 2 Type 2, ISO 27001, and GDPR certification. For companies navigating the EU Pay Transparency Directive (enforcement June 2026), that compliance foundation isn't really optional (unless you’re a big fan of fines and ruined reputation).
Create defensible, competitive salary bands in minutes
Smart compensation decisions require more than competitive pay – they demand bulletproof justifications. When your CFO questions that senior engineer’s salary band, you need confidence-building language at your fingertips.
Picture walking into that meeting armed with: "According to real-time data from 127 similar European tech companies in our revenue bracket, this range represents the 50th-75th percentile for senior engineers in Berlin."
That’s the power of evidence-based vocabulary. No more vague “market research suggests” statements. Instead, you get:
- “Based on HRIS-verified data from companies with 200-500 employees…”
- “Current Q3 benchmarks show a 12% increase in this role since January…”
- “Among GDPR-compliant European firms, the median compensation includes…”
European companies face unique challenges: US-centric tools miss local nuances, generic surveys lack GDPR compliance, and market depth varies wildly between Copenhagen and Cluj-Napoca.
Figures addresses these exact pain points with 3.5 million data points powered by Mercer's methodology, built-in GDPR-compliance by design, European market expertise, and local depth that actually reflects your reality.
“Once we had set our policy, Figures enabled us to establish our concepts,” says Mathilde Fontaine from Welcome to the Jungle. “…The solution also helped us to ask ourselves the right questions, step by step. In particular, advice was given on granularity and salary ranges, which was very interesting.”
Ready to transform compensation conversations from defensive to definitive? Book your personalised demo today.

Summarize this article with AI
No time to read it all? Get a clear, structured, and actionable summary in one click.