Key points:
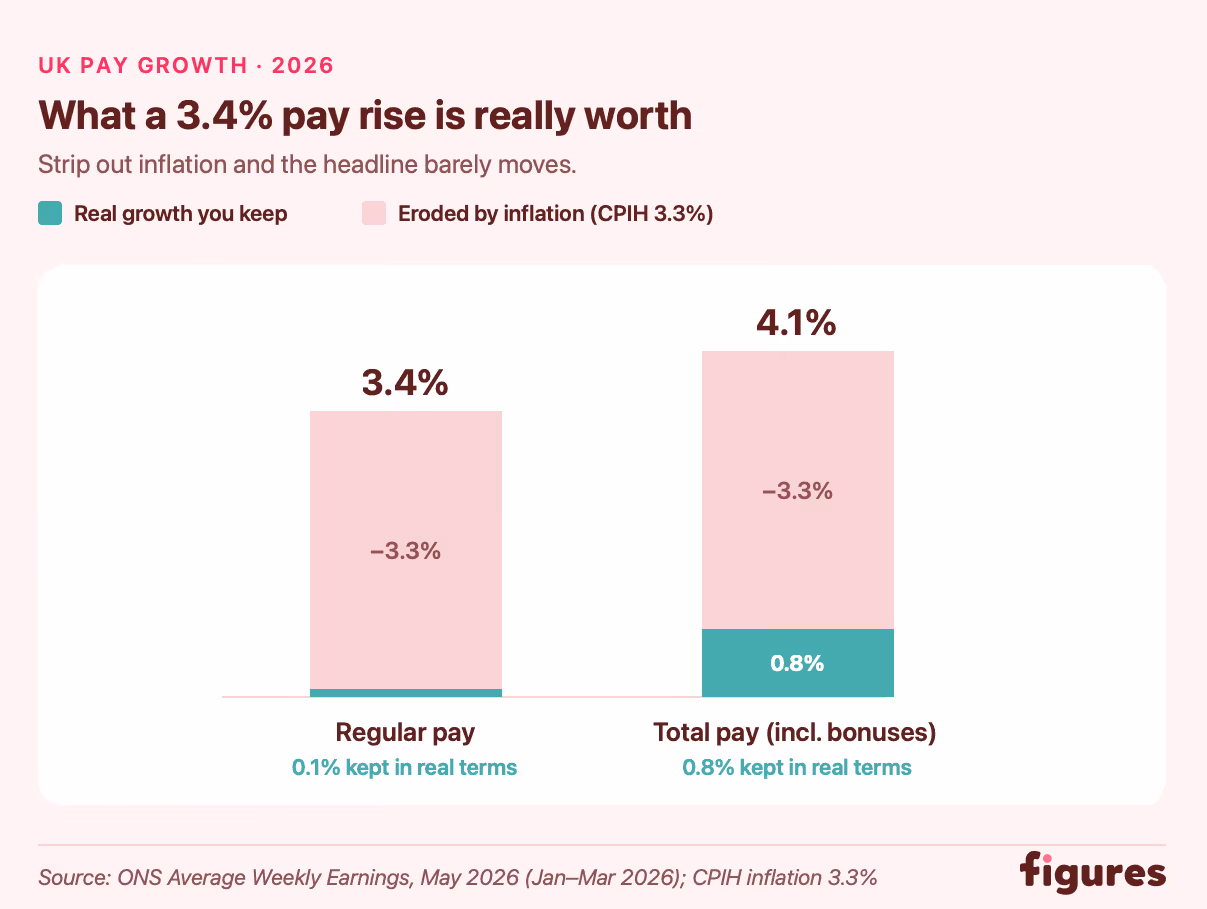
- The average UK pay rise is 3.4%. Regular pay rose 3.4% and total pay 4.1% in the year to January–March 2026 (ONS).
- After inflation, it's barely positive. With CPIH at 3.3%, regular pay grew just 0.1% in real terms – effectively standing still.
- Sources disagree because they measure different things. Published figures range from 2.2% to 5%, depending on mean versus median and actual versus planned pay.
- Sector decides far more than the average. Pay growth runs from 10.3% in finance to a 0.6% fall in construction.
- Employers are budgeting around 3% for 2026. Most split that across merit, promotion, market and equity pots rather than one flat raise.
Setting a pay budget should be simple. You find the average UK pay rise, apply it across your teams, and you're done.
Then you start looking – and the "average" turns out to be anything but. One source says 2.2%, another says 5.0%. Which one do you take to your board?
This article sorts it out using the latest ONS Average Weekly Earnings bulletin (May 2026 release). We'll cover what the headline figure means once inflation takes its cut, how pay growth splits by sector, what employers are budgeting for the year ahead, and how to benchmark in a way that actually holds up in the room.
{{ ai }}
What is the average pay rise in the UK right now?
Right now, the average UK pay rise is 3.4% for regular pay (salary, no bonuses) and 4.1% for total pay (bonuses in), for the year to January–March 2026. That comes from the ONS Average Weekly Earnings bulletin, the closest thing to a settled number we have, built from around 12.8 million employees. It's also easing off: regular pay was running near 4.5% at the end of 2025 (BBC).
Now, about that spread. Every figure you found is technically correct – they're just answering slightly different questions.
So, why the differences?
- The ONS takes the mean across millions of payslips.
- ASHE takes the median from a smaller annual sample.
- Hays asks recruiters.
- HR Data Hub asks employers what they intend to pay out.
The topic and the question are the same, but the measurements are different, which is why the numbers refuse to line up.
So when someone quotes you "the" average pay rise, the sensible reply is a question back: average of what, measured how? Get that straight before you build a budget on it.
Nominal vs. real pay growth in 2026
Every headline figure – the 3.4% included – is nominal. That's the raw percentage before inflation takes its cut. To see what a rise is genuinely worth, you subtract inflation, and what's left is your real pay growth.
Nominal pay rise − inflation = real pay growth
So let's run the current numbers. Consumer Prices Index (CPIH) inflation averaged 3.3% over the year to March 2026 (ONS AWE). Which gives us:
- Regular pay: 3.4% − 3.3% = 0.1% real growth. Treading water.
- Total pay: 4.1% − 3.3% = 0.8% real growth – though that's bonuses doing the heavy lifting, and not everyone gets one.
So the typical salaried employee is standing still. A 3.4% award against 3.3% inflation looks generous on a payslip and barely registers at the supermarket till.
🤔 A quick rule to keep handy for pay reviews: anything below CPIH is a real-terms pay cut, however nice the percentage reads. Match CPIH, and you've held the line. Beat it, and you've actually given someone a raise.
And it has been far worse. From November 2021 to June 2023, UK wages grew more slowly than inflation for 20 months straight – the longest stretch of falling real wages in modern UK history, and that lost ground was never clawed back (Statista). So 0.1% is thin, but it's at least on the right side of zero.
Trade slow PDF reports for live, GDPR-compliant UK and European pay data.
Discover salary benchmarkingPublic sector vs. private sector pay growth
You'll have seen the headline: public sector pay up 7.2%, private sector limping along on 3.4%. Nearly four points apart, and easy to read as the state handing out rises while everyone else makes do.
Don't. That gap is mostly a timing trick.
Some public sector rises in 2025 were paid earlier in the year than they were in 2024, which inflates the year-on-year comparison (ONS). As that quirk drops out of the data, the gap closes quickly:
ASHE, which sidesteps the timing issue altogether, has the two sectors growing at almost exactly the same rate. So before you tell your board the public sector is racing ahead, check which window the number came from – it changes the story completely.
Average pay rise examples by sector and industry
A national average is a blunt instrument. It blends finance and construction into one tidy figure, as if a banker and a bricklayer earned their raises the same way. The real spread:
The range runs from 10.3% at the top to a 0.6% fall at the bottom – almost eleven points between the best and worst sectors in the same year. It’s worth noting that ONS explicitly warned that the large finance jump is partly an artifact of sample-composition changes in the ASHE panel. But nevertheless, benchmark against "the UK average" and you're already miles off for most of your roles.
What you also need to consider is the National Living Wage. It rose 6.7% in April 2025, and the Low Pay Commission reckons it nudges up to just under a fifth of the whole UK wage bill through spillover, with affected workers seeing an average 6% rise. That's much of why retail, hospitality and caring roles are holding firm while better-paid sectors cool off.
Is 3%, 4%, or 5% a good pay rise?
Annoyingly, there's no single answer. A 4% rise can be brilliant for one person and barely adequate for another in the same week. Whether yours is any good comes down to four things.
- Your sector. Glance back at the table above. A 4% rise in construction is a small miracle this year; the same 4% in financial services is well below what your peers are getting.
- Inflation. Strip out roughly 3.3% CPIH from any figure to see what it's actually worth. A 4% rise leaves you about 0.7% better off in real terms – modest, but ahead of the economy-wide average and most planned awards.
- Whether you stayed put or moved up. ONS headline figures cover basic pay awards only. The CIPD points out that promotion uplifts, bonuses and pay bumps from changing jobs all sit on top of those averages. Someone who got promoted and someone who stayed in the same role aren't playing the same game, so don't measure them against the same number.
- Where you are. London pays the most in absolute terms. On growth, the picture flips: pay rose fastest in Northern Ireland (7.4%) and slowest in the South East (2.9%) over the year to April 2025. The best-paid region isn't the fastest-growing one.
Put it together, and you get a rough scorecard for 2026:
The honest takeaway for anyone setting pay: "good" is the number that beats inflation and holds up against your sector. Hit one without the other and someone will notice.
🤔 One limit: these are broad-brush sector figures. They won't tell you what a sustainability lead, a paralegal or a backend engineer should earn in your city at your company size. For that, you need data cut far finer than anything the ONS puts out – which is where this starts getting properly difficult.
What UK employers are budgeting for pay rises in 2026
Enough about what already landed in payslips. What are employers actually planning to hand out this year?
Clustered tightly, as it turns out. IDR found 39% of employers planning rises of 3%–3.49%, with another 22% in the 3.5%–3.99% band and 16% going slightly lower at 2.5%–2.99%. The CIPD's much larger sample of over 2,000 employers points to the same ~3% median, so this isn't a small-survey wobble.
You might wonder why these planned figures sit below the ONS actuals. Simple: surveys capture base-pay awards, while the ONS measures everything that actually reached people – promotions, National Living Wage uplifts and mid-cycle corrections all included.
When HR teams settle on a number, they're weighing several things at once:
- Inflation expectations for the year ahead.
- Retention risk in roles that are hard to replace.
- The total budget finance will actually sign off.
- Where existing salaries sit against their bands.
- Individual performance.
That is where a flat percentage starts to fall apart – and where the next section picks up.
Ditch the 12-tab spreadsheet. Give managers clear recommendations and live budget tracking. Button: Discover compensation review →
How employers are slicing the 2026 budget pie
The days of handing everyone the same inflation-matching bump are fading. Overall budgets are projected at around 3.8%, but the more telling shift is what's happening inside that number. Rather than one flat raise across the board, HR teams are carving the budget into four separate pots, each with a job to do.
That growing equity pot is worth watching. With the EU Pay Transparency Directive now live and active, companies setting money aside now are the ones who won't be scrambling later.
It also depends on the size: smaller firms (1–50 staff) are budgeting around 4.6%, mid-market (151–500) about 3.7%, and the largest employers (1,000+) closer to 3.0%.
That 3.0% lines up neatly with the CIPD and IDR base-pay medians. The higher 3.8% headline simply reflects smaller companies' bigger budgets plus all four sub-budgets bundled into one total.
Splitting a budget four ways on a spreadsheet is where pay planning gets fiddly fast. Figures' free 2026 Annual Salary Increase Budgets guide walks through the workings if you want the details.
From averages to benchmarks that match your workforce
By now, one thing should be clear: every national figure in this article is a starting point, never a finishing line. "The UK average" can't tell you what to pay a mid-level data engineer in Manchester, or whether your finance team has quietly slipped below market. For that, you need numbers cut to your roles, your locations, and the size of your company.
That's the gap Figures' benchmark module fills – 3.5 million Mercer-powered data points, filterable by industry, level, location and company size, refreshed monthly rather than once a year. Pair it with the compensation review module, and you can run a full pay review on real-time data, with budgets tracked live and recommendations backed by evidence instead of guesswork.
Ready to swap "the average" for numbers that fit your workforce?
Make compensation decisions you can defend to your CFO, your team, and EU regulators. Button: Get a custom demo →
FAQs
What's the difference between regular pay growth and total pay growth?
Bonuses, basically. Regular pay leaves them out; total pay folds them in. According to the ONS, right now that's 3.4% regular against 4.1% total. In bonus-heavy corners like finance, the two can drift much further apart, which is why it always pays to check which one a headline is quoting.
Is wage growth in the UK slowing down?
Steadily, yes. Nominal growth peaked near 8% in late 2022, eased to around 4.5% by late 2025, and now sits at 3.4% for regular pay. The Bank of England is watching the trend closely for its rate decisions, and the April 2025 jump in employer National Insurance is squeezing total pay budgets on top.
Do promotion increases count in average pay rise figures?
Mostly they don't. Headline ONS and employer-survey numbers track basic pay awards. The CIPD is clear that progression, promotions, bonuses and pay bumps from switching jobs all sit on top of those averages, counted separately rather than blended in. So someone who moved up isn't measured by the 3.4% headline at all.