Key Points:
- Monthly updates beat annual surveys: Figures update benchmarks monthly using 3.5 million data points. Traditional guides lag 6-12 months behind market reality.
- Company size drives pay differences: Mid-market UK companies (250-1,000 employees) pay Senior Data Scientists £92,800 median. Staff developers earn 24% more than Senior levels.
- Fix job architecture first: Mismatching your internal levels to market benchmarks invalidates every pay decision. Build clear levelling frameworks before comparing externally.
- EU compliance deadline: June 2026: The Pay Transparency Directive requires a documented benchmarking methodology and defensible peer groups for pay gap reporting.
Salary benchmarking is the process of comparing internal compensation levels against external market rates based on specific criteria, including role, seniority level, location, industry, and company size.
It's a core compensation strategy that removes the guesswork and provides a data-driven foundation for pay decisions.
For UK businesses in 2026, the case for precise benchmarking is obvious. In 2025, LinkedIn reported that nearly two-thirds (61%) of UK professionals planned to look for a new job. And while not the only reason, pay is a big reason for people heading for the door.
Proactive pay adjustments are significantly more cost-effective than reactive counteroffers, which often fail once an employee is disengaged. So, you’ll need to get ahead of the curve and see whether you’ve actually got a compensation package that’s competitive.
That’s where benchmarking comes in. It can help prevent financial damage from overpayment whilst ensuring you don't lose top talent to competitors due to underpayment.
But to remain competitive in the fast-moving tech sector, benchmarks should be reviewed regularly. That means you can’t rely on the financial reports published every six months to a year. You’ll need monthly updates that ensure data never goes stale – a critical advantage when market rates can shift dramatically quarter-to-quarter.
{{ ai }}
Real UK tech salaries by percentile (250-1,000 employees)
Generic salary averages don't cut it for enterprise compensation decisions.
You need data filtered by company size, location, and seniority level. The specifics that determine whether your offers actually compete. This is where most traditional salary guides fall short. They publish broad national averages that lump together seed-stage companies with FTSE 100 enterprises, treating a Senior Engineer at a 50-person firm the same as one managing critical infrastructure at a 2,000-person organisation.
The thing is, company size dramatically impacts compensation expectations. So if that’s not taken into account, you’re only reading half the story.
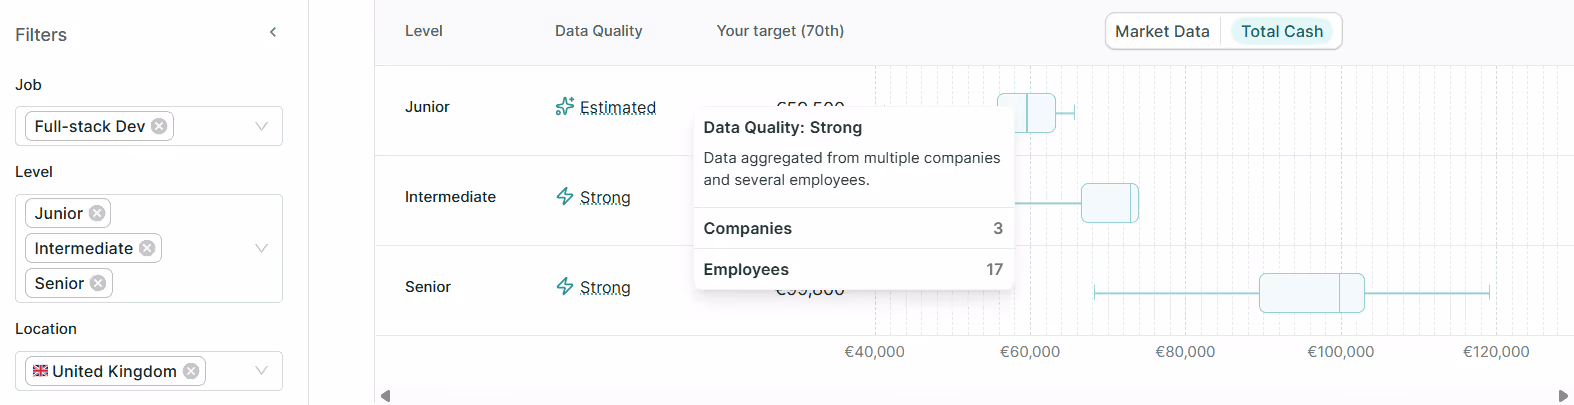
Using data from platforms like Figures, which draws on over 3.5 million data points through its partnership with Mercer, we can examine what enterprises actually pay for critical tech roles. Unlike annual reports that are outdated before publication, this data updates monthly, reflecting current market conditions rather than last year's reality.
Here's what UK enterprises are actually paying right now (February 2026) for in-demand tech roles:
Source: Figures Benchmark, February 2026
What the numbers reveal
The spread between percentiles tells you how much flexibility you have. Senior Data Scientists show a tight range from £83,400 to £96,000 between the 25th and 75th percentiles. That £12,600 spread means the market has reached consensus on what these roles are worth.
Security Engineers, conversely, show a £24,000 spread (£61,700 to £85,700). This reflects the diverse nature of security work, whether it’s infrastructure security, application security, or compliance-focused roles; they all carry the "Security Engineer" title but command different compensation.
This sample represents just a fraction of the benchmark data available. Book a demo with Figures to see how enterprises filter real-time salary data by company size, location, and industry, updated monthly, not annually.
The "AI Premium" that makes your general benchmarks fail
Everyone knows AI roles are hot. The London School of Economics ranked "AI Engineer" as the most in-demand tech career for 2026. But knowing something is in demand and knowing exactly what to pay for it are two very different skills – and only one of them stops your offer getting laughed out of someone's inbox.
Here's what's actually happening to tech salaries right now.
The Figures Salary Index tracks real-time payroll movement across the UK using a chain-linked methodology that strips out composition bias (so new companies joining the dataset can't skew the numbers). Between October 2025 and April 2026, the picture looked like this:
That last line deserves a second look. While the rest of the tech market was doing its best impression of a flatline, AI roles grew nearly 3% in just six months – roughly 12 times faster than the broader market.
Average base salary for AI roles in the UK now sits at approximately £90,700, well above the wider tech average.
🤔 Did you know? We're seeing the same upward pressure in France and across Europe. When Figures converts UK AI salaries to euros and combines them with French data, the trend holds: average base salary for AI roles rose +2.12% over the same period. This isn't a UK-only quirk – it's a structural shift across the continent.
So what does this mean in practice? Well, one simply cannot benchmark AI roles using annual salary surveys published six months ago. It’s just going to be constantly behind.
"The speed of movement in AI salaries also creates a compliance headache. Under the EU Pay Transparency Directive, companies need to justify pay differences with objective, data-backed methods – and that's almost impossible for fast-moving AI roles without real-time benchmarks." – Virgile Raingeard, CEO at Figures
📌 The bottom line: when the most sought-after roles in tech are also the ones where salaries shift fastest, waiting for end-of-year reports is a gamble – and the house (read: your competitors with fresher data) always wins.
Top UK tech salary benchmarking sources
Reliable benchmarking requires moving away from unverified "free" data.
What doesn't work:
- Glassdoor and job ads: Self-reported, unverified, lacking context on company size, total comp, or seniority levels. It’s okay if you want a basis to work from… but you shouldn’t base real decisions on what you see on Glassdoor.
- Traditional surveys (Robert Half, Robert Walters): Industry credibility but suffer from a 6-12 month data lag, by the time you access the report, the market has already moved on.
- ChatGPT and LLMs: Asking AI for benchmarking is tempting. You can get an answer in seconds, and it sounds pretty authoritative, right? That’s the trap. In our ChatGPT salary benchmarking study, we found that it could be wildly inaccurate, though it can provide ballpark figures for roles with rich compensation data.
So, what can you trust?
Figures uses a "give-to-get" model, integrating directly with 30+ HRIS tools for monthly-updated, verified payroll data.
Through a partnership with Mercer, you get:
- European/UK depth with over 3.5 million data points.
- GDPR-compliant architecture.
- Real compensation decisions, not survey estimates.
- Monthly updates instead of annual snapshots.
When a competitor raises salaries in March, you'll see it reflected in April's benchmarks, not next January's survey report.
💡 Figures features in the latest Novo Insights’ Comp Tech Category Snapshot: Pay Equity and Transparency report, highlighted as a key solution for organisations building their CompTech roadmap to meet the EU Pay Transparency Directive requirements. Book a demo to see why Figures is ranked as a leading provider for EU Directive readiness.
Best practices for salary benchmarking
Moving from sporadic lookups to a repeatable benchmarking system requires a strategic framework.
Define your compensation philosophy first
Decide if you want to lead the market (75th percentile) or remain at the median (50th). There’s nothing wrong with staying at the 50th percentile, especially if you’ve got a tighter compensation budget.
However, while paying at the 75th percentile means more costs in total payroll, it positions you as a premium employer. At the 50th percentile, you probably won’t be able to compete for the top talent (unless you’ve got exceptional benefits), but you still position yourself as someone whose salary bands are fair for the industry.
Fix your job architecture before you benchmark
This is where most benchmarking efforts fail.
Accurate benchmarking is impossible without a clear levelling and grading framework. You must map roles internally before comparing them externally. Your "Senior Engineer" might be equivalent to another company's "Staff Engineer", which will skew your numbers heavily.
Build a competency matrix that defines what distinguishes a mid-level from a senior-level, and what’s included within those job roles. Document the scope, autonomy, and impact expected at each level. Only then can you reliably match internal roles to external benchmarks.
Look beyond the number
Benchmarks reflect market rates, but they don't account for your specific needs.
Use them as a baseline, then adjust for:
- Hot skills: AI, cybersecurity, and cloud computing command premiums above generic benchmarks.
- Brand strength: Lesser-known companies competing against prestigious brands need to pay above market rate.
- Hiring urgency: Critical roles with tight timelines may require 75th percentile positioning even if your philosophy targets the median.
Build for regulatory readiness
With the EU Pay Transparency Directive set to take effect in June 2026, your benchmarking must support gender pay gap reporting and internal equity audits.
This means documented methodology, defensible peer groups, and the ability to explain why two people in the same role earn different amounts. Benchmarks provide the external validation that makes these conversations survivable.
‼️This goes for the UK too. Especially if you’ve got offices in Europe. But it also applies if you want to compete for European talent. That means, if you haven’t already, focus on strong pay transparency practices and demonstrate that pay equity is important to your business.
Total compensation, not only base salary
A competitive offer in 2026 involves more than a monthly deposit. While salaries do attract the eye, it’s also about what companies can offer alongside monthly pay packets.
What to benchmark beyond base:
- On-target earnings (OTE): Include bonuses and commissions to understand true cash compensation.
- Equity grants: Stock options or RSUs can represent 20-40% of total comp for senior roles (though Figures' native data focuses on cash. Best to use Carta or Pave for equity-heavy benchmarking).
- Benefits value: Pension contributions, private medical, and remote work flexibility all factor into candidate decisions.
See that point about remote work flexibility? This actually has a big impact on attracting talent. Hybrid working models (we’re including remote work, too) and clear career development paths now rank as top priorities for UK tech talent. So much so that it often outweighs a 5-10% salary difference.
Use Compa-ratios for internal equity
A Compa-ratio shows how individual salaries sit within your defined bands relative to performance:
- 0.80-0.90: Below range, typically new hires or developing talent
- 0.90-1.10: Within range, performing as expected
- 1.10-1.20: Above range, high performers or critical retention risks
Benchmarks tell you what the market pays. Compa-ratios tell you if you're paying your people fairly relative to that market and their performance.
Run your tech salary benchmarking with Figures
Manual benchmarking – defining peer groups, mapping roles, wrestling with Excel – is a recipe for error and "spreadsheet gymnastics".
Figures is the cure to that quarterly pain, by providing an ongoing system that Finance trusts and managers actually use.
What you get:
- Real-time benchmarks: Monthly updates from 3.5 million data points, not annual snapshots
- HRIS integration: Automatic sync with 30+ systems eliminates manual data entry
- Saved filters: Build peer groups once, reuse them across quarterly reviews
- Compliance-ready reports: Built for EU Pay Transparency Directive requirements with GDPR architecture
Figures saves HR teams approximately 3 weeks of work during compensation review cycles. That's time redirected from data gathering to strategic conversations about retention, performance, and equity.
Book a free demo to see how Figures handles benchmarking for UK and European companies navigating the 2026 transparency deadlines.