

Pay is never far from your employees’ minds. Groceries, rent, and heating bills all keep climbing, and employees are expecting more help from you, as their employer, to keep up. In numbers, workers worldwide expect an average pay rise of 5% this year.
Here’s the problem: most companies don’t have that much to give, and maybe you fall into that bracket. If so, you’re far from alone — Figures’ compensation insights survey shows salary increase budgets will average just 4.5% in 2025, down slightly from 4.8% last year. The gap between what employees expect and what employers can give leaves HR teams caught in the middle — trying to stretch limited budgets while keeping people motivated and fairly rewarded.
This guide covers how salary range penetration can support fairer decisions when budgets are tight — helping you see who’s progressing as expected, where any inequities may be hiding, and which employees are at risk of feeling “stuck.” This guide won’t help you magically find more money (wouldn’t that be a trick?) — but it can help you build trust and keep your workforce moving forward.
What is salary range penetration?
At its simplest, salary range penetration tells you how far an employee has progressed along the pay scale within their assigned salary band. Every band has a minimum (the starting point for someone new to the role), a midpoint (what’s considered fully competent for the role), and a maximum (the ceiling of what the band allows).
Think of it like a battery bar on your phone or laptop:
- At 0% penetration, the salary sits at the very bottom of the band.
- At 50% penetration, the salary is right in the middle.
- At 100% penetration, the employee has reached the top of the band.
It’s a pretty easy way to see who’s just starting out, who’s building toward the midpoint, and who’s bumping against the ceiling of their band — all of these insights link directly to equity, career growth, and retention.
Why does salary range penetration matter?
Pay decisions are never simple. Budgets are tight, employees expect more, and managers often lack the tools to explain how on earth pay connects to performance. Here’s how salary range penetration brings everything into clear focus.
Bolsters pay equity by highlighting patterns
Despite years of progress, the gender pay gap remains stubborn. The World Economic Forum’s Global Gender Gap Report 2025 found the gap is only 68.8% closed worldwide, although this does vary significantly. For example, Iceland, the top performer, has achieved 92.6% closure.
At an organisational level, the University of Strathclyde’s Equal Pay & Pay Gap Report 2025 points to vertical occupational segregation as one of the root causes of pay inequity. Essentially, women are overrepresented in lower pay grades, and men are more common in higher ones. The same problem can also play out within a single salary band.
Pro tip: Use penetration data to spot inequities. If women or other underrepresented groups are clustered near the band minimum while others progress further, that’s clear evidence of bias you can act on.
Supports career progression conversations
Employees want to know where they stand, but managers often struggle to explain it. Penetration provides a simple visual. Instead of vague talk about growth, a manager can show how far someone has moved through their band and what opportunities lie ahead.
Pro tip: Bring penetration data into performance reviews. It turns career progression into a concrete discussion, linking pay movement to contribution in a way that feels fair and motivating.
Guides smarter budgeting and workforce planning
Salary compression and outdated ranges put real pressure on budgets. Penetration analysis shows where there’s still space for progression, where raises will stretch furthest, and where promotion or rebanding may be the better path.
Many organisations still stop at short-term forecasting. McKinsey’s HR Monitor 2025 reports that while 73% of companies run operational workforce planning, only 12% of HR leaders extend their view three years out. Too often, businesses are stuck in short-term mode.
Pro tip: Review penetration by team or function, not just individual. It highlights where budgets will run out fastest and where to prioritise investment.
Aids retention by flagging potential risks
Compensation remains a top driver of turnover. 46% of employees plan to look for work in the next three months, showing just how imminent your next wave of departures could be. Meanwhile, iHire’s research finds that 1 in 5 people quit because of unsatisfactory pay.
Pro tip: Flag employees above 85% penetration for closer attention. Without a promotion path or rebanding option, high performers near the ceiling may already be planning their exit.
How to calculate salary range penetration in 3 simple steps
Salary range penetration might sound like something out of a finance textbook, but once you’ve set up the basics it’s pretty straightforward. Think of it as a three-step process:
1. Create salary bands
You can’t butter your toast until you’ve toasted the bread, and you can’t calculate salary range penetration without salary bands in place.
Every role should have a minimum (the entry point), a midpoint (what “fully competent” looks like), and a maximum (the ceiling for that role).
Example: A content marketing manager might have a salary band between €50,000 to €70,000.
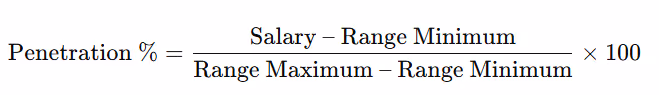
2. Use a salary range penetration formula
Once your salary bands are in place, it’s time to do the math. Don’t panic — the formula looks scarier than it is. In plain English, you subtract the minimum of the band from the employee’s salary, then divide that number by the total size of the band. The result is their penetration, expressed as a percentage.
How to calculate salary range penetration
Example 1
- Miguel is a customer success associate earning €45,000. The salary range for his role is €40,000 to €60,000.
- To work out the range penetration: (45,000 – 40,000) ÷ (60,000 – 40,000) = 0.25 or 25%.
- Miguel is 25% into his band, with lots of room to grow before reaching the maximum.
Example 2
- Sophie is a project manager making €82,500. Her band runs from €75,000 to €90,000.
- To work out the range penetration: (82,500 – 75,000) ÷ (15,000) × 100 = 50%.
- Sophie is right in the middle of her range — a good sign she’s established in the role.
Example 3
- Aisha is a senior analyst earning £122,000 in a £100,000–£125,000 band.
- To work out the range penetration: (122,000 – 100,000) ÷ (25,000) × 100 = 88%.
- Aisha is close to the top of her band — a flag that it might be time to discuss her next steps.
3. Act on the results
Running the numbers is only half the story; what matters next is how you use the insights. Salary range penetration helps you spot risks, opportunities, and patterns across your workforce. Here’s a quick checklist you can use as a guide.
☑ Are certain groups clustered at the low end of the range?
This could point to pay equity issues across gender, age, or department.
☑ Do we have high performers close to the top of their range?
Time to consider a promotion, rebanding, or retention bonus.
☑ Are newer employees progressing through the band over time?
Stalled progression may highlight issues with career development or manager support.
☑ Is salary spend evenly distributed across the band?
If most employees are bunched at one end, your pay structure may need recalibration.
☑ Does our penetration analysis align with compa-ratio or market data?
If not, you may be competitive externally but unfair internally (or vice versa).
☑ Do we have enough “headroom” in each band to allow for raises?
If too many employees are already at the top, bands may be too narrow or outdated.
How salary range penetration compares to other pay positioning strategies?
Salary range penetration is useful, but it’s not the only way to measure pay. HR teams often combine different metrics to get a fuller picture of fairness, competitiveness, and progression. Here’s how salary range penetration stacks up against compa-ratio, range quartile or quintile positioning, and market index/ratio.
Build fairer pay structures with Figures
On its own, salary range penetration is only part of the bigger compensation picture. To build pay strategies that are truly fair, competitive, and future-ready, you need accurate market data and the right tools to put insights into action.
That’s where Figures comes in. Our platform helps you design salary bands, benchmark against the market, and track equity across your organisation — so every pay decision is transparent and backed by data.
Ready to make fair pay your standard, not your struggle? Book a demo and see how Figures can help you get there.
{{ cta }}

Summarize this article with AI
No time to read it all? Get a clear, structured, and actionable summary in one click.
.avif)
.avif)
.avif)

