Key points:
- Fit beats headcount: The right platform is decided by how you pay and operate, not company size – a 10,000-person base, bonus and equity setup suits Figures, while a smaller firm with complex global incentives may suit beqom.
- Scope: Figures covers salary bands, compensation reviews, pay equity, benchmarking and EU directive compliance in one platform; beqom adds LTI, sales-commission, executive comp, deferred payments and job architecture for global enterprise complexity.
- EU Pay Transparency Directive: Figures has the directive tooling built in from the entry tier. beqom covers it too, through its PaySuite Pay Equity & Transparency product, built on the PayAnalytics tech it aquired in 2023.
- Benchmark data: Figures refreshes its own European benchmark monthly, where beqom has no benchmark of its own and imports annual third-party surveys; the separate Figures × Mercer alliance adds breadth across 110+ countries.
- Ease of use: G2 reviewers rate Figures easier to use (8.9 vs 8.0) and to set up (8.8 vs 6.9), and it goes live in weeks against beqom's ~9-month average.
Choosing a compensation platform is a decision you live with for years, so it's worth getting right. If Figures.hr and beqom are both on your shortlist, you've already worked out that a spreadsheet won't carry structured pay decisions or the EU directive much longer, and that you want real market data behind every call.
The two tools look similar from the outside: both help HR teams make fair, confident pay decisions on objective data. Where they differ is who they're built for and how they expect you to work, and that's what settles which one fits your company, whatever your headcount.
So here's the straight comparison, module by module: scope and architecture, benchmarking, pay equity and the EU directive, personalisation, implementation, and pricing, then a clear read on which suits which team.
How do Figures and beqom compare?
Both are compensation platforms, so the real question is fit: which architecture and operating model matches how your company pays people. Headcount barely comes into it, which is why the useful way to read the table below is by the shape of your pay setup, not the size of your team.
What is Figures?
Figures is a European compensation platform that helps HR teams make and justify objective pay decisions using the full compensation context (HRIS and payroll data, performance, salary bands, market benchmarks and pay gaps) not market data alone. It serves more than 500 companies across Europe, including Qonto, Doctolib and Treatwell, and holds SOC 2 Type 2, ISO 27001 and GDPR certification.
EU Pay Transparency Directive tooling is built in, and it connects to 30+ HR systems through an API. Compensation Review is its most-used module, and reviews, rules and increase letters can be tailored to each business unit and local pay policy. It suits European teams from a few hundred employees up to 10,000.
What is beqom?
beqom is a Swiss compensation platform that runs compensation, performance and total rewards for large global organisations. Its breadth is the point: long-term incentives, sales-commission plans, executive comp and deferred payments, managed across many legal entities.
All of that, however, comes with the setup effort you'd expect from enterprise software, which is why beqom fits best where compensation is actually that complex.
Now, here's how the two compare across some important dimensions:
What does each platform cover?
Figures covers salary bands, compensation reviews, pay equity, benchmarking and EU directive compliance in one platform. That set is built around the core pay decision: what someone should earn, how it compares against the market and your own bands, and how you record and defend it afterwards. Keeping those pieces together is the point, because comp reviews, equity analysis and compliance reporting all read from the same data instead of being split across separate tools you then have to reconcile.
Performance is handled through connection. Figures pulls performance ratings from the tool you already use and feeds them into the compensation review through its suggestion matrix, so merit decisions reflect performance without Figures running a performance module of its own.
beqom's PaySuite is built wider. Alongside compensation and pay equity, it manages long-term incentives, sales-commission plans, executive comp and deferred payments, and adds native performance management plus job architecture and grading. If your pay runs on vesting schedules, variable sales comp or deferred awards across many entities, that breadth is the reason to look at beqom.
So the honest way to judge coverage is by how you actually pay people. Base, bonus and equity, structured and kept compliant in one place, is what Figures is built for. Layered incentive schemes across a global entity map are what beqom is built for.
Which platform has fresher benchmark data?
Figures refreshes its benchmark data monthly, drawn from HRIS-integrated European companies, so pay decisions reflect what the market is paying now.
beqom has no benchmark module of its own: market data has to be imported from third-party annual surveys, chiefly Mercer and Willis Towers Watson (WTW), which cover a lot of countries but update on a yearly cycle.
That gap matters most when you're pricing a role or setting a band in a fast-moving market: a monthly-refreshed European dataset tracks current pay, while an annual survey reflects last year's.
One thing to keep straight, because it's easy to muddle: Figures runs two separate data streams. The Benchmark module above is Figures' own data, collected from its European customer base and refreshed monthly. The Figures × Mercer alliance is a distinct offering that adds Mercer's benchmark breadth across 110+ countries for teams that need international depth. They're different datasets doing different jobs, so treat the monthly-refresh point and the 110-country point as two separate facts.
Benchmarking is the input to a confident pay decision, and the two platforms diverge more sharply on what they do with it next.
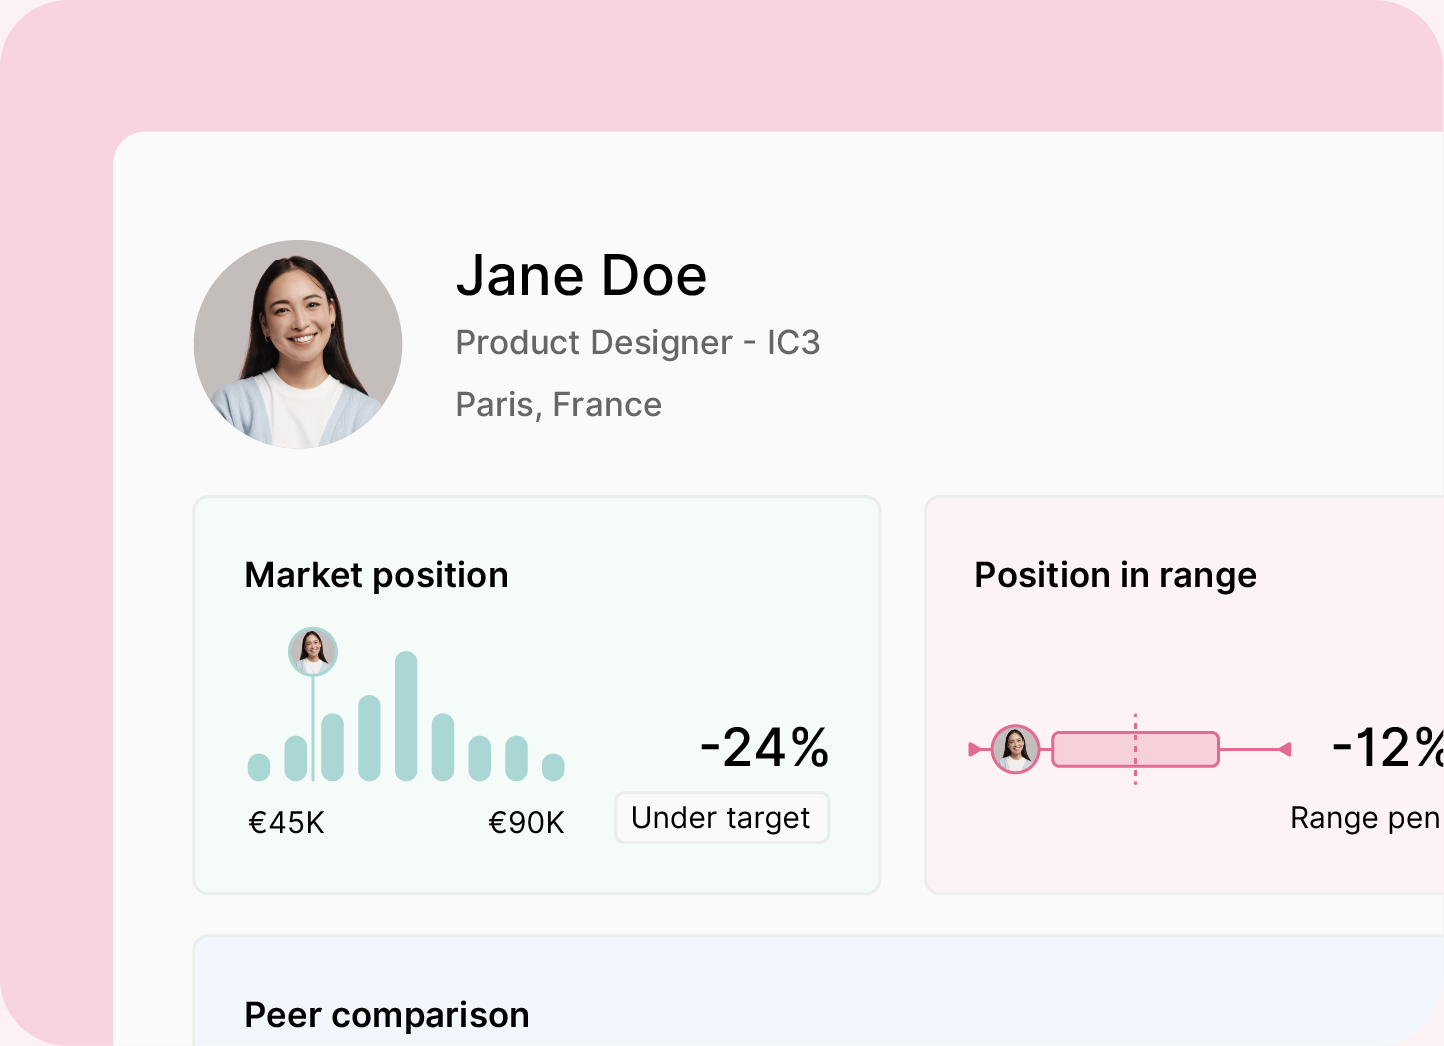
Pay data for fast-growing UK and EU companies, from 3.5 million datapoints, updated monthly.
Discover salary benchmarkingHow does each platform handle pay equity?
Figures builds pay equity into the platform natively, across two tiers, so equity analysis runs on the same data as your salary bands and reviews.
- Pay Equity Foundations comes with every plan: automated gender pay-gap reports, employee right-to-information letters, and analysis that flags raw pay gaps above 5% by worker category.
- Pay Equity Expert adds advanced gap analysis, remediation scenarios and budget-aligned correction planning, as an add-on or on its own.
beqom does pay equity too, through its PaySuite Pay Equity & Transparency product, which is built on PayAnalytics, the specialist tool it bought in December 2023 and now sells as part of the platform.
You buy it as one product in an enterprise suite, though, whereas Figures puts Pay Equity Foundations in every plan, so your gap analysis is already running on the same data as your bands and reviews the day you go live.
How do Figures and beqom handle the EU Pay Transparency Directive?
Figures builds EU Pay Transparency Directive tooling into the platform natively from the entry tier, so European teams can run directive-ready reporting without an enterprise rollout. That covers a country-by-country tracker, employee information letters, audit trails and directive-aligned pay-gap reports.
First, the current picture. Directive (EU) 2023/970 set a transposition deadline of 7 June 2026 that most member states missed, and gender pay-gap reporting applies once you pass 100 employees. It phases in by company size:
- 250+ employees: first report due by 7 June 2027, then every year.
- 150–249 employees: first report due by 7 June 2027, then every three years.
- 100–149 employees: first report due by 7 June 2031, then every three years.
💡 A missed national deadline doesn't delay the directive itself: it has had direct effect across the EU since June 2026. France, which missed transposition, is now expected to bring its law into force on 1 January 2028.
Filing the report is the easy part, though. Figures has the directive tooling in every plan, so your local teams can keep on top of each country's obligations and tell every employee, in plain terms, why they're paid what they're paid, and you're live in weeks rather than after an enterprise rollout.
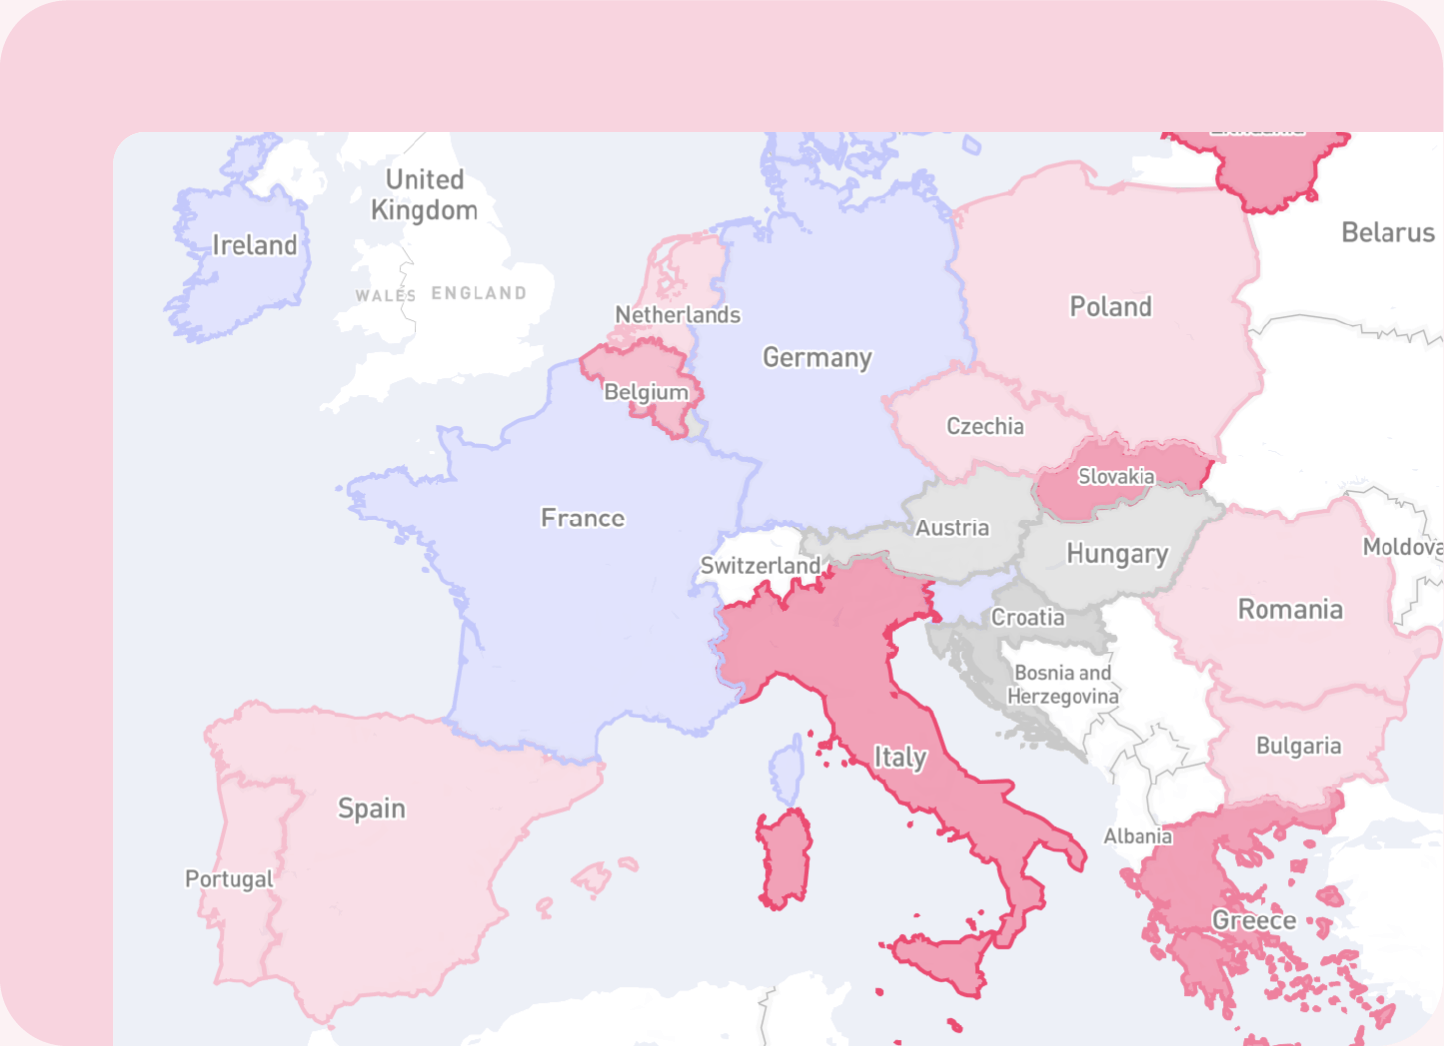
The EU Pay Transparency Directive is in effect. Find out where your pay gaps stand.
Discover pay transparencyHow customisable is each platform?
Figures lets HR teams tailor every compensation review to their own business units, pay policies and local rules, without a technical project to set it up. In practice, that's a set of controls you configure yourself:
- Hard and soft rules that block out-of-policy raises, or flag them for justification.
- A suggestion matrix that turns performance, market data and salary bands into tailored increase recommendations.
- Sandbox mode to model a campaign before it goes live.
- Role-based permissions so each manager sees only their own team.
- Salary-increase letters generated in multiple languages.
For an international team, that adds up to central control with local flex: you tailor pay strategy to each subsidiary's policies, apply local rules, and still report on the whole org from one platform.
beqom offers deep configurability aimed at data-science teams, and it takes longer to set up by design. That depth suits an enterprise with dedicated comp engineers; Figures is built so an HR team can run its own comp cycle without one.
So customisation comes down to who does the configuring. beqom is built for comp specialists and data-science teams; Figures is designed for local HR teams and managers who run the cycle, which is exactly why it's built around a clear interface rather than expert configuration.
Figures vs beqom: Which is easier to use?
Based on user reviews, Figures is the easier platform to integrate into existing workflows. Independent G2 reviewers rate it easier to use, set up, and administer than beqom:
The biggest difference is in the setup, and it tracks with how long each takes to go live. beqom Compensation Management averages around nine months to implement, per G2 verified reviews. Figures gets teams live in 4 to 6 weeks: European fintech Swan positioned 100% of its employees within salary bands in its first cycle.
The reason is architecture. Figures connects to 30+ HRIS and review systems like BambooHR, HiBob and Deel through an API, which suits a mid-sized European stack. beqom uses native enterprise connectors for SAP SuccessFactors, Oracle HCM and ADP, built for a global SAP or Oracle estate and part of why it takes longer to stand up.
The honest version: Figures is built for company sizes where a few weeks to value is realistic, and beqom is built for compensation complexity that takes longer to configure by nature. If your setup needs LTI plans and sales-commission engines wired across many legal entities, that longer runway buys something real. If it doesn't, you're paying it for complexity you won't use.
Faster to set up only counts if the price is right, so the last practical question is cost.
Comparing pricing for Figures vs beqom
Neither platform publishes a full price list, but the models differ in a way that changes how you buy.
- Figures is quote-based, priced on headcount plus the modules you pick. The plans are public even if the numbers aren't: Structure as the foundation, Companion for compensation reviews, and Pay Equity Expert as an add-on or standalone. You can scope roughly what you need before booking a demo.
- beqom also quotes bespoke, with no public pricing. Cost is driven by deployment scale, LTI and sales-commission configuration, and implementation services, so the figure usually lands at the end of a full enterprise sales cycle.
The practical difference: Figures' modular structure lets you pre-qualify what you're paying for, whereas beqom is an enterprise sales conversation from first contact.
Which compensation platform fits your company?
The choice depends on two main things: how you pay, and how you operate.
- Fit by architecture. If your compensation runs on base, bonus and equity, and your pressing jobs are pay equity and EU directive compliance, Figures is built for exactly that. If it runs on long-term incentives, sales commission or deferred pay at scale, that's beqom's territory, and the breadth is worth the heavier setup.
- Fit by operating model. If you want centralised control over pay decisions across several countries from one platform, Figures fits. If you're a global enterprise with entity sprawl standardised on SAP or Oracle, beqom is the safer home.
So, plainly: Figures is the compensation platform for European teams that want to make, explain and defend pay decisions across multiple countries, without an enterprise rollout. You get real-time European benchmarks, native pay-equity and directive tooling from the entry tier, and a comp cycle your HR team can run without a dedicated engineer. And headcount is the wrong axis to decide on: a 10,000-person company that pays on base, bonus and equity is a Figures fit, while a 600-person company running complex global incentive plans might be a beqom one.
If that first description sounds like your team, the quickest way to know for sure is to watch Figures run your own comp cycle. Book a custom demo!
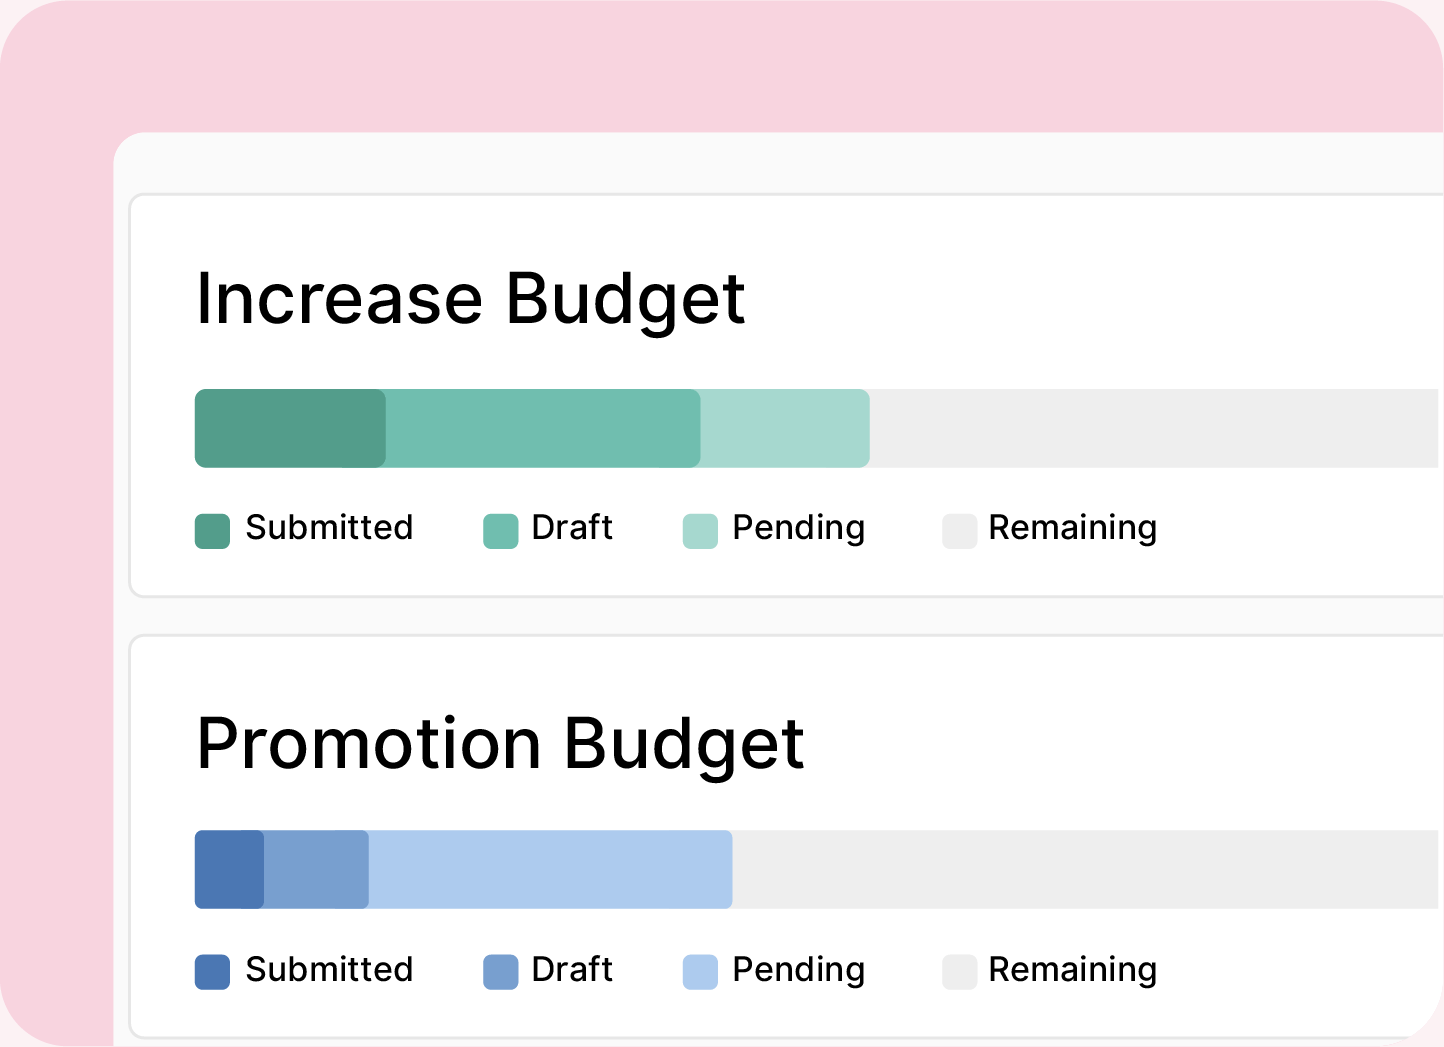
Save up to 3 weeks on your next salary review cycle. For HR teams of 250+ employees.
Discover compensation review