Key points:
- Employee turnover cost is the total expense of replacing a departed employee. It includes direct costs (recruitment, onboarding) and indirect costs (lost productivity, knowledge loss). Industry research shows replacement costs typically range from 50% to 200% of an employee's annual salary.
- Calculate turnover costs in two ways: Use the quick formula (Average cost per departure × Number of departures) for immediate estimates, or follow the detailed step-by-step model that breaks down separation, recruitment, onboarding, lost productivity, and vacancy costs.
- Compensation is the top reason employees leave (38%), but it ranks fifth for why they stay (28%). This means competitive pay prevents job hunting but won't create loyalty alone. Job security, work-life balance, and relationships matter more for retention.
- Replacement costs scale with seniority: Entry-level roles cost 30-50% of salary to replace, mid-level professionals cost 100-150%, senior specialists cost 150-200%, and executives cost 200%+ due to longer ramp-up periods, scarcer talent pools, and greater knowledge loss.
Employee turnover cost is the total expense of replacing a departed employee, including direct and indirect costs.
That’s all good, but what are the actual numbers? Quite high as it turns out. Industry research shows replacement costs typically range from 50% to 200% of an employee's annual salary.
For one employee, you might think that your annual budget can take that hit. But consider that in 2024, employee turnover (churn) in the UK was 34%. For a company with 200 employees, that's 68 people cycling through your doors each year. At a £50,000 average salary, you're potentially spending £1.7 million to £6.8 million annually just replacing people who leave.
It’s something that many organisations don’t take as seriously as they should, and that’s because many of them are just making guesses on costs. But with our help, you’ll get a quick estimate you can calculate today, as well as a comprehensive model you can present to finance. Because it’s an expense that businesses can’t afford to ignore.
The true cost of employee turnover
Employee turnover costs fall into two categories: hard costs and soft costs.
Hard costs are direct and measurable:
- Recruitment fees.
- Job advertising spend.
- Onboarding expenses.
You can pull these numbers straight from your finance system.
Soft costs are indirect but equally real:
- Lost productivity while a role sits empty.
- Knowledge that walks out the door with departing employees.
- The impact on team morale when colleagues shoulder extra work.
- Customer relationships that suffer during transitions.
🤔 Some companies call these direct costs and indirect costs. They’re exactly the same as the terms laid out above, so don’t be confused if you see them in your finance files.
The biggest challenge there is that soft costs are incredibly difficult to quantify. You can’t put numbers on knowledge and team morale (though we bet some of you would love to), but that doesn’t mean those costs can’t add up. If customers aren’t spending as much, and productivity and motivation are down, those costs can add up. And they can cost you more than hard costs.
Unfortunately, while soft costs are hard to calculate, you’ll need them to calculate the cost of employee turnover. Before we get to that, let’s take a look at both costs in more detail.
Direct costs
The replacement cycle follows four stages:
‼️Oxford Economics estimates the average cost per replacement at £30,614. This includes £5,433 in logistical costs covering recruitment and onboarding. Based on these figures, logistical direct costs account for approximately 18% of the total.
Now, keep in mind that the study was done over a decade ago. £30,614 adjusted for inflation in 2025 would be roughly £42,843. And that’s for one employee…
Indirect and hidden costs
Six categories drive the majority of replacement expenses:
💡 Costs rise with seniority:
Replacing senior employees costs significantly more than replacing junior staff. Here's why:
- Longer ramp-up periods: Senior hires take more time to reach full productivity.
- Scarcer talent pools: Specialist roles mean longer vacancies and higher recruiter fees.
- Greater knowledge loss: Senior employees hold more institutional knowledge and client relationships.
- Higher base salaries: Even the same percentage represents a higher absolute cost.
A junior marketing coordinator might cost 50% of their salary to replace. Your Head of Marketing? Closer to 200%. But how would you work that out? Onto the formula!
The formula for estimating employee turnover cost
First, calculate your turnover rate:
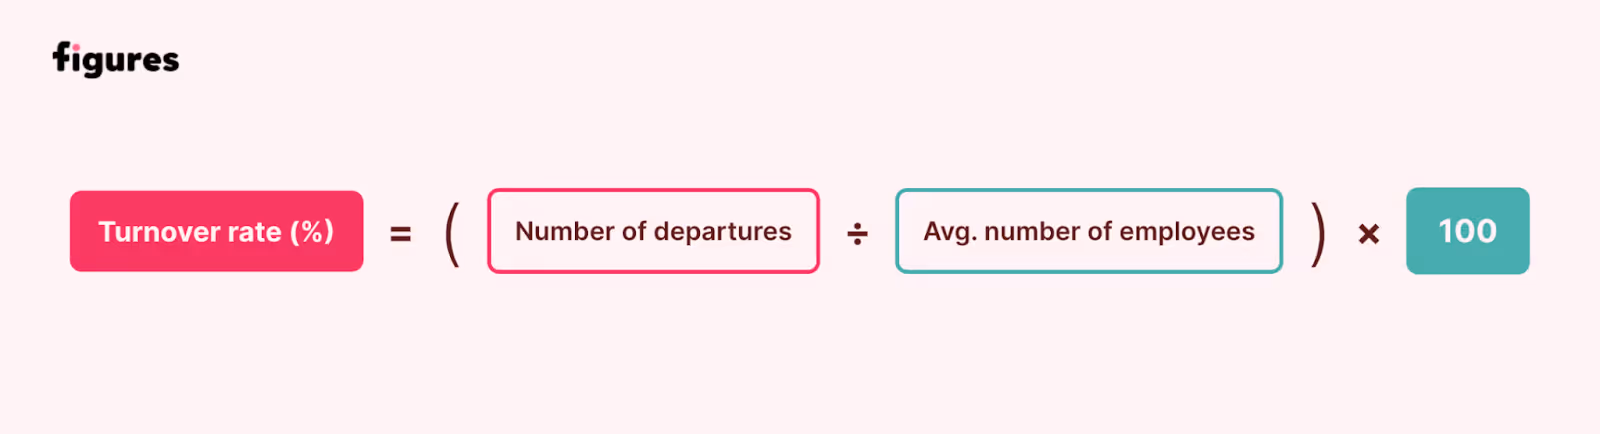
Turnover rate (%) = (Number of departures ÷ Average number of employees) × 100
Let’s look at what that would look like for a mid-size business. Your company has 200 employees. Last year, 68 people left.
Turnover rate = (68 ÷ 200) × 100 = 34%
🤔 Some organizations calculate net turnover by including new hires (you would subtract the number of new hires from the total employees who left, which would look like a reduced turnover rate). But for cost calculations, focus on departures only. Each person who leaves incurs replacement costs.
Then, calculate the cost of that turnover using this commonly used formula cited in HuffPost:
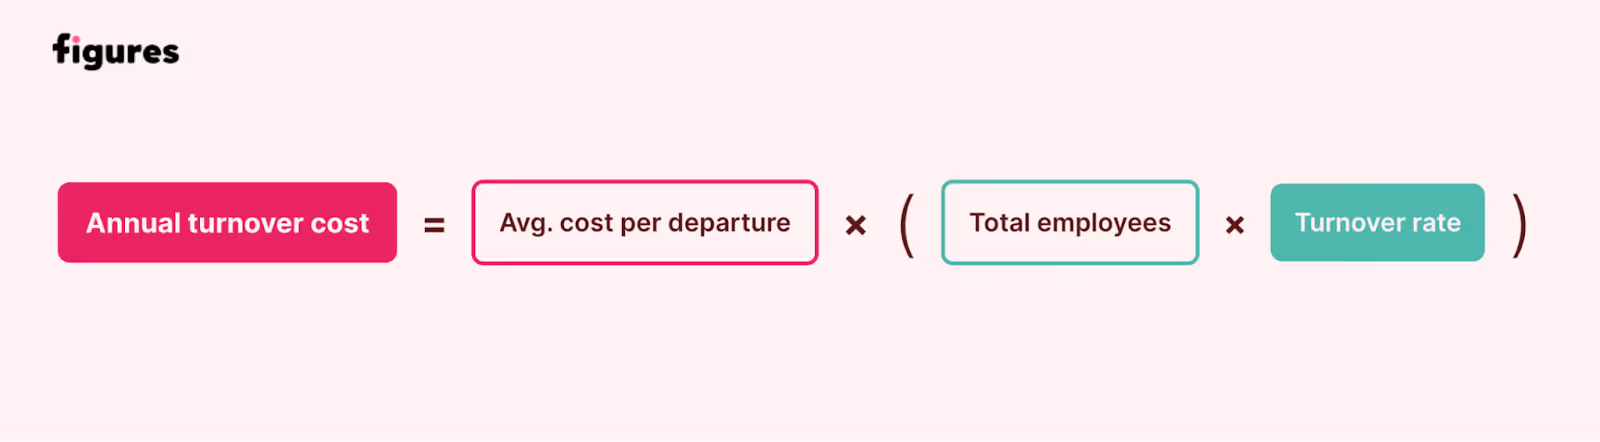
Annual turnover cost = (Average cost per departure) × (Total employees × turnover rate)
Where average cost per departure = (Hiring + onboarding + development + unfilled time).
We’ll use the Oxford Economics figure of £30,614 average cost per replacement:
Annual turnover cost = £30,614 × 68 departures = £2,081,752
It’s a pretty scary number usually, but it’s at least defendable, and something concrete that you can show to Finance. But what about on an individual level?
Employee turnover cost: benchmarks and UK example
That estimate only tells one side of the story and doesn’t account for seniority. This can add huge increases to the overall costs, as you can see below:
- Entry-level and hourly roles: Around 30-50% of annual salary.
- Mid-level professional and technical roles: 100-150% of annual salary.
- Senior and specialized roles: 150-200% of annual salary.
- Executive and C-suite positions: 200% or more of annual salary.
Now let's calculate the actual cost for a specific role.
- Role: Mid-level, front-end developer, based in London
- Base salary: £60,000
- Fully loaded cost: £72,000 (salary + employer National Insurance + pension + benefits).
Industry benchmarks measure replacement cost as a percentage of base salary, not fully loaded cost. Applying the 100-150% mid-level benchmark: £60,000 base × 100-150% = £60,000 to a whopping £90,000 in turnover costs.
🤔 These costs all depend on your internal and external practices. Competitive salaries, solid job architecture, and transparent pay structures can give you the edge you need to get talent through the door quicker. Internally, solid onboarding and training, bonus schemes, and good customer service and management can all help keep turnover costs down.
Why employees leave (and why they stay)
You've just calculated the costs of losing your (hypothetical) front-end developer. Now the harder question: could you have prevented it?
Not all turnover is avoidable. Sometimes people relocate, change careers, or retire. But a significant portion of departures happen because something at work isn't working. And those are the factors you have control over and can fix.
So, we’re going to have McKinsey's 2025 HR Monitor help out. They surveyed over 4,000 employees across the UK and Europe to understand what actually drives job changes versus what keeps people in place.
Top reasons employees changed jobs in the past five years:
- Remuneration and benefits (38%).
- Training and development opportunities (28%) – closely tied to clear pay progression frameworks that show employees a path forward.
- Flexibility – hours, remote/hybrid options (27%).
- Relationship with manager (26%).
- Work-life balance (25%).
Top reasons employees stay with their current employer:
- Job security (39%).
- Work-life balance (34%).
- Relationships with colleagues (33%).
- Flexibility (31%).
- Compensation and benefits (28%).
Job security has risen to the top retention factor. It ranked fifth just one year earlier, suggesting employees increasingly value stability over pay alone. Which makes sense. More jobs are being lost to AI, and the UK unemployment rate sits at a five-year high, according to the ONS.
We can also see that compensation matters, but plays a smaller role in retention. It's the primary reason people leave (38%), but it ranks fifth for why they stay (28%). This tells you something important: competitive pay gets people through the door and prevents them from job hunting, but it won't make them loyal on its own.
And without loyalty, you get disengagement. Disengaged employees who stay but underperform represent a hidden cost that rarely appears in turnover calculations. They're on your payroll but delivering partial productivity – sometimes for years at a time.
What can you do to reduce employee turnover?
The answer is a lot. Here's where to focus your retention efforts:
- Listen and encourage feedback: conduct regular one-to-ones and exit interviews to understand why people actually leave, not why you think they're leaving.
- Improve onboarding: effective training reduces that expensive 6-month ramp-up period we calculated earlier.
- Create clear development paths: remember, 28% of job changes happen because people can't see how to progress.
- Prioritise wellbeing and flexibility: work-life balance, flexibility, and relationships consistently rank in the top five retention factors.
- Benchmark salaries regularly: ensure pay remains competitive and fair across your organisation.
"Compensation is the most measurable retention lever you have. You can't put a precise number on 'toxic manager' or 'lack of career growth.' But you can absolutely quantify whether someone is paid 15% below market, and fix it before they start interviewing elsewhere."
— Virgile Raingeard, CEO at Figures
While compensation is definitely measurable, it can be difficult to know how your salary bands stack up to your competitors. And unless you’re trawling through Glassdoor, you’ll need a solution to help. Well, let’s introduce you to a tool that can make a world of difference.
Use Figures to reduce pay-driven turnover
Now that you can quantify what turnover costs your organisation, the next question is which portion you can prevent. Compensation dissatisfaction – the top driver why people leave – is addressable with the right data.
Figures address pay-driven turnover through four modules:
- Benchmark: Identify employees below market before they job hunt. Access 3.5M+ datapoints with monthly updates to spot salary gaps before they become resignation letters. For organisations ready to move beyond annual reviews, dynamic pay design keeps structures aligned with real-time market shifts.
- Salary bands: Prevent pay compression where new hires earn nearly as much as veterans. Show employees clear progression paths so they can visualise their future with your company.
- Compensation review: Run systematic, data-backed salary adjustments. The platform saves HR teams up to 8 hours per week by eliminating manual benchmarking processes, freeing that time for retention conversations.
- Pay equity: Surface internal pay gaps that erode trust. Companies with effective pay equity see 45% lower turnover risk. Use our post-audit pay equity checklist to address gaps systematically.
What Figures does not do: predict turnover or measure engagement. The platform addresses compensation competitiveness, one of many drivers. It won't fix poor management, lack of development opportunities, or toxic culture.
EU Pay Transparency Directive: Figures generate compliance-ready reports for June 2026 requirements, including gender pay gap analysis and salary range disclosures.
For a deeper dive on addressing pay-driven departures, see our guide on competitive pay retention strategies.
Put your calculation to work today
So, you’ve got a good idea of where your money goes when an employee leaves, and a quick formula to give you an estimate of the costs.
For that £60,000 front-end developer, you could pay anywhere between £72,000 and £108,000 in measurable replacement costs. Multiply that across all your departures, and the business case for retention becomes undeniable.
The calculation reveals something important: vacancy costs, lost productivity, and recruitment fees dwarf the actual separation expenses. Prevention beats reaction every time.
Compensation sits at the top of why employees leave (38%). It's also the most quantifiable retention lever you control.
Ready to address pay-driven turnover? Book a Figures demo to see how real-time compensation benchmarking helps you identify flight risks before they start job hunting.

Summarize this article with AI
No time to read it all? Get a clear, structured, and actionable summary in one click.